
Categories
Housing ReportsPublished July 1, 2026
Orange County Housing Report: Easing Into Summer


Orange County Housing Report: Easing Into Summer
June 22, 2026
Orange County housing has officially transitioned to the Summer Market, when the inventory rises and peaks, demand slowly falls, and the market slows.
The Summer Market
The housing market will slow until the inventory peaks sometime over the summer.
Graduates have thrown their caps into the air, celebrating the turning of a new chapter. Families are carefully packing their suitcases and boarding planes for a much-needed vacation. At the public pool, the smell of sunscreen permeates the air, as the hot sun beckons everyone to jump into the water. From cover band concerts to blockbuster movie releases to a hike on an intermediate trail, all of summer's many distractions have arrived.
As everyone turns their attention to summer activities, the housing market evolves and shifts slightly downward. In terms of demand and market speed, the Spring Market is the busiest and strongest time of the year for housing. It is when many families look to isolate a home, write a purchase contract, and then move during the summer when the kids are on summer break. Many families and individuals still have housing goals, but it often takes a back seat to all the fun that summer has to offer.
The various seasons of the housing market do not necessarily align precisely with the official start and end dates of the four seasons. Summer officially begins on June 21st, the summer solstice, the longest day of the year. Yet, in housing, it aligns with when the kids are out of school, around the end of May. The Summer Market spans June, July, and August. By the end of August, the kids are back in school, and housing transitions to the Autumn Market.
In Orange County, demand (a snapshot of the number of new pending sales over the prior month) eases as many summer activities temporarily pause buyers’ efforts in securing a home. The supply of available homes slowly rises until it peaks sometime between July and August. Until the inventory isolates that peak, the market will continue to slow weekly.
Last year, the inventory was 4,645 homes at the start of June, peaked at 5,071 at the end of July, and fell to 4,869 by the end of August. Overall, the inventory still climbed by 5% from June to August. At the same time, demand decreased from 1,633 to 1,559 pending sales, a 5% decline. The Expected Market Time increased from 85 to 94 days, up 9 days. 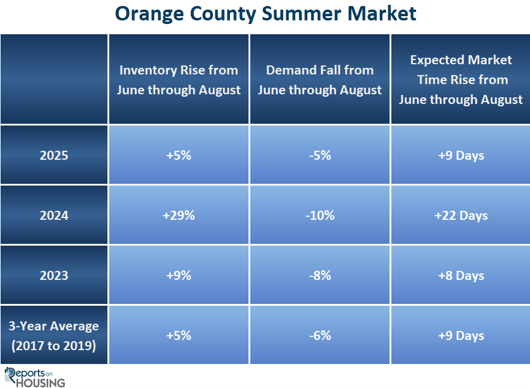
In 2024, the inventory ballooned by 29%, demand dropped by 10%, and the Expected Market Time increased by 22 Days, a major deceleration, from 51 days in June to 73 days by the end of August. In 2023, with the inventory growing by 9% and demand falling by 8%, the Expected Market Time increased from 41 to 49 days, up 8 days. In looking at the 3-year average before the pandemic (2017-2019), the inventory grew by 5%, demand dropped by 6%, and the Expected Market Time increased from 70 to 79 days, up 9 days.
Many homeowners mistakenly think summer is the best time of the year to place their homes on the market. There is an elevated number of homes coming to market, yet demand has already hit its peak in the spring. The supply outpaces buyer demand. The extra homes placed on the market accumulate until housing reaches its summer peak. Demand peaked at the beginning of May at 1,678 pending sales and has dropped by 72 since, a 4% decline. At the same time, the supply of available homes has grown from 4,307 in May to 4,681 today, up 374, or 9%. The market slowed from 77 to 87 days amid increasing seller competition. The Orange County housing market will continue slowing until the supply stops growing.
There are a lot of homes that come on the market over the summer. While May is the peak month for the number of homes entering the market, July is a close second, and June is not far behind. Fewer homes come to market in August, and then it downshifts for the remainder of the year. 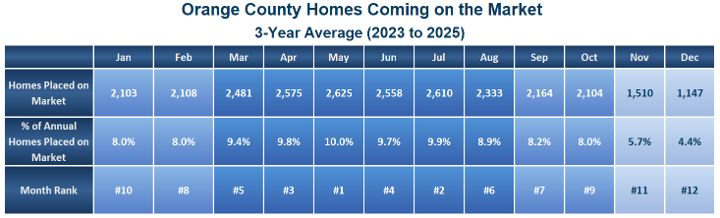
Many sellers will come to market during the summer, anticipating a quick sell as if it were early spring. Additionally, as the market slows each week, buyers may get ahead of themselves and expect the market to line up in their favor and prices to come down. Instead, the market is much more balanced, with negotiations not favoring buyers or sellers. It is currently a tug-of-war between buyers’ and sellers’ sentiments. Buyers pull back due to affordability challenges, and sellers pull back due to a lack of urgency. Most sellers have plenty of equity, a low mortgage rate, and really do not have to sell. As a result, there is a real stickiness to pricing.
As housing eases further into summer, buyers, sellers, and everyone connected to real estate will feel the Summer Market shift. Many homes that are carefully priced and in turnkey condition will still fly off the market, but for everyone else, the market will feel a bit more subdued.
Active Listings
The inventory increased by 3% in the past couple of weeks.
The active listing inventory increased by 130 homes over the past two weeks, up 3%, to 4,681, its highest level since last September. It is the Summer Market. The inventory will continue to climb weekly until a peak is reached sometime between July and August. Many sellers are concluding that their window to take advantage of the hottest time of the year for housing will rapidly close if they do not secure success over the next several weeks. More sellers are reducing their asking prices to better align with the market before time runs out. 37% of all currently available homes have reduced the asking price at least once.
Last year, the inventory was at 4,894 homes, 5% more than today, with 213 additional homes. The 3-year average before COVID (2017 through 2019) was 6,633, an additional 1,952 homes, or 42% more.
Homeowners continue to “hunker down” in their homes, unwilling to move because of their current, underlying, locked-in, low fixed-rate mortgage. This trend has been easing from the lows established in 2023. Through May, 13,342 homes were placed on the market in Orange County, 4,937 fewer than the 3-year average before COVID (2017-2019), 27% less. In 2025, 13,831 homes entered the market (4% more), compared to 11,786 in 2024 (12% less), and 10,062 in 2023 (25% less). Slightly fewer homes have been coming to market this year than last. 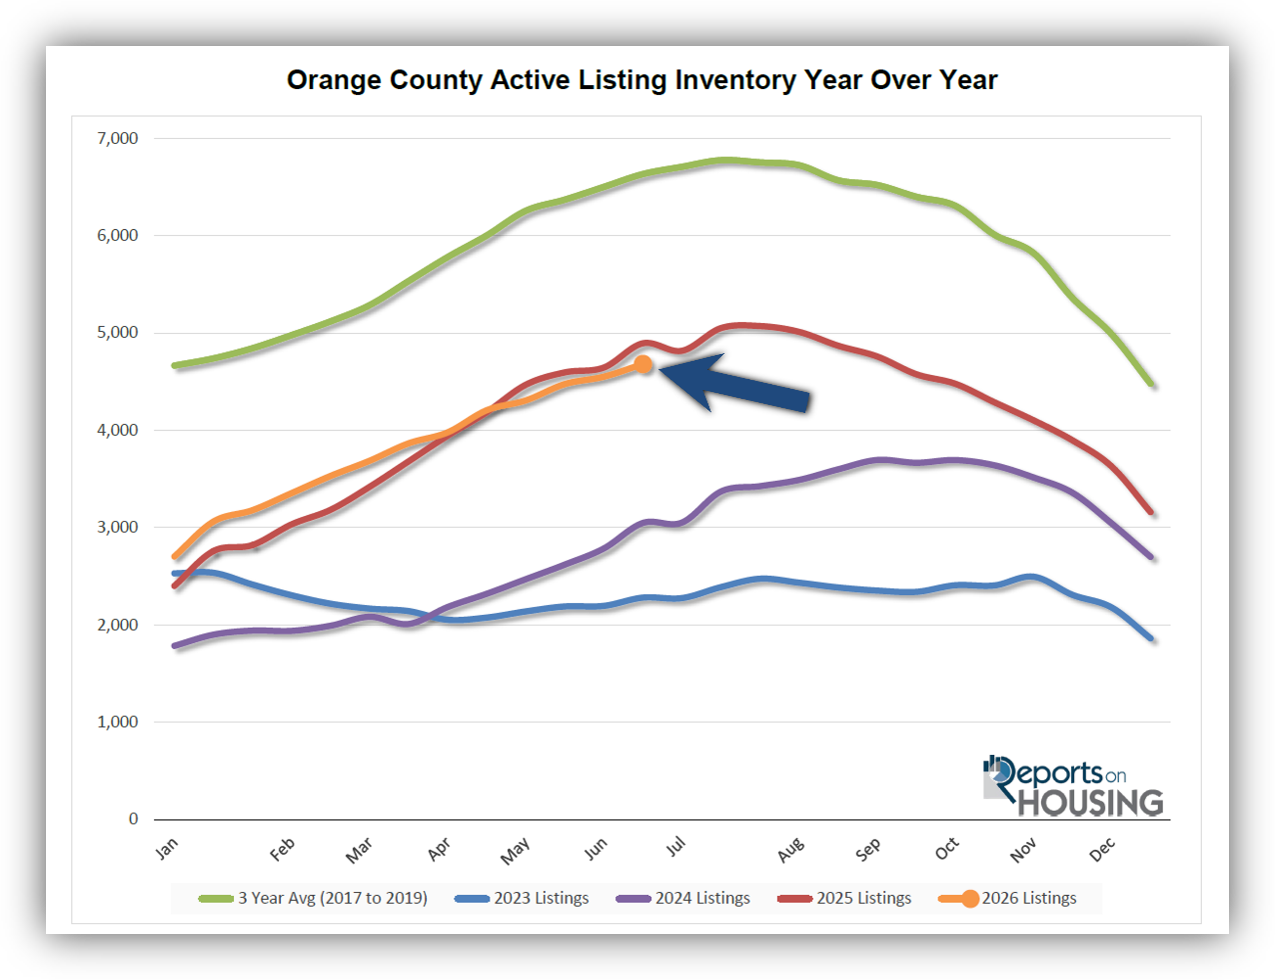
Demand
Demand decreased by 2% in the past couple of weeks.
Demand, a snapshot of the number of new pending sales over the prior month, decreased from 1,637 to 1,606 in the past couple of weeks, down 31 pending sales, or 2%. Demand closely resembles the subdued levels seen from 2023 through 2025, well below what is typical for this time of year. The 3-year average before the pandemic (23017-2019) was 2,679, that is an additional 1,073 pending sales (+67%). Today’s 1,606 pending sales are not much different than last year’s 1,614. It was 1,615 in 2024 and 1,602 in 2023. Today’s subdued demand is due to affordability challenges. Until rates fall towards 6% or fall into the 5s, expect demand to remain sluggish.
Last year, demand was 1,614, with 8 additional pending sales (nearly unchanged). The 3-year average before COVID (2017 to 2019) was 2,679 pending sales, 67% more than today, or an additional 1,073.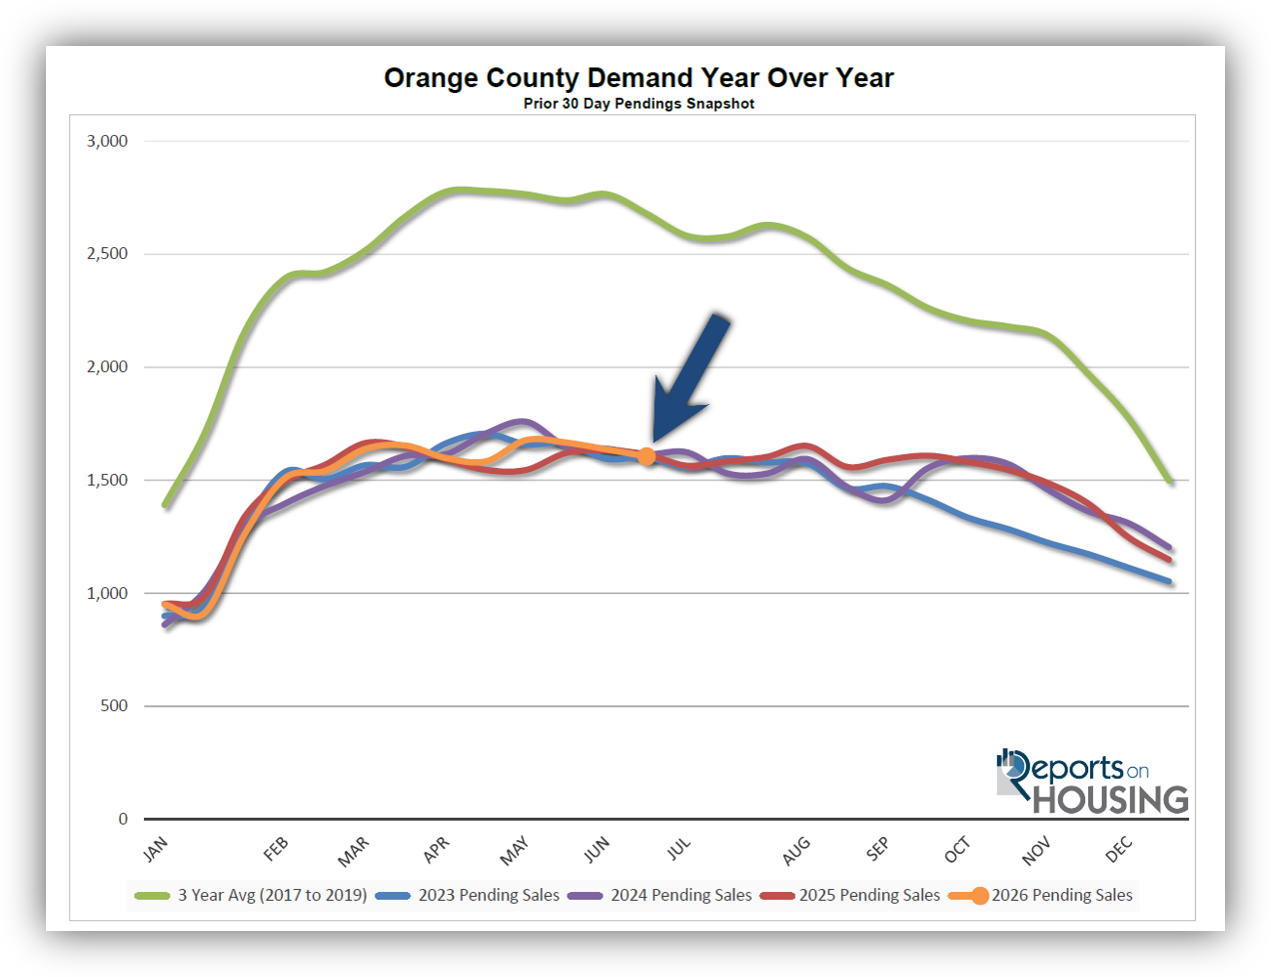
As the Federal Reserve has indicated, it is essential to monitor all economic releases for signs of a slowdown. These releases can cause mortgage rates to rise or fall, depending on how they compare with market expectations. It is also important to monitor any developments in the Iran conflict and its impact on the oil market, and ultimately inflation, which can also cause mortgage rates to rise or fall. This week marks the release of the S&P Global Manufacturing and Services Purchasing Managers Index (PMI), which tracks the strength of the U.S. manufacturing and services sectors. On Thursday, the Personal Consumption Expenditures – Price Index (PCE), the Fed’s preferred inflation gauge, will be released. Next week is jobs week, which includes the number of job openings, wages, and the number of jobs created or lost, one of the month’s most important economic data points.
Expected Market Time
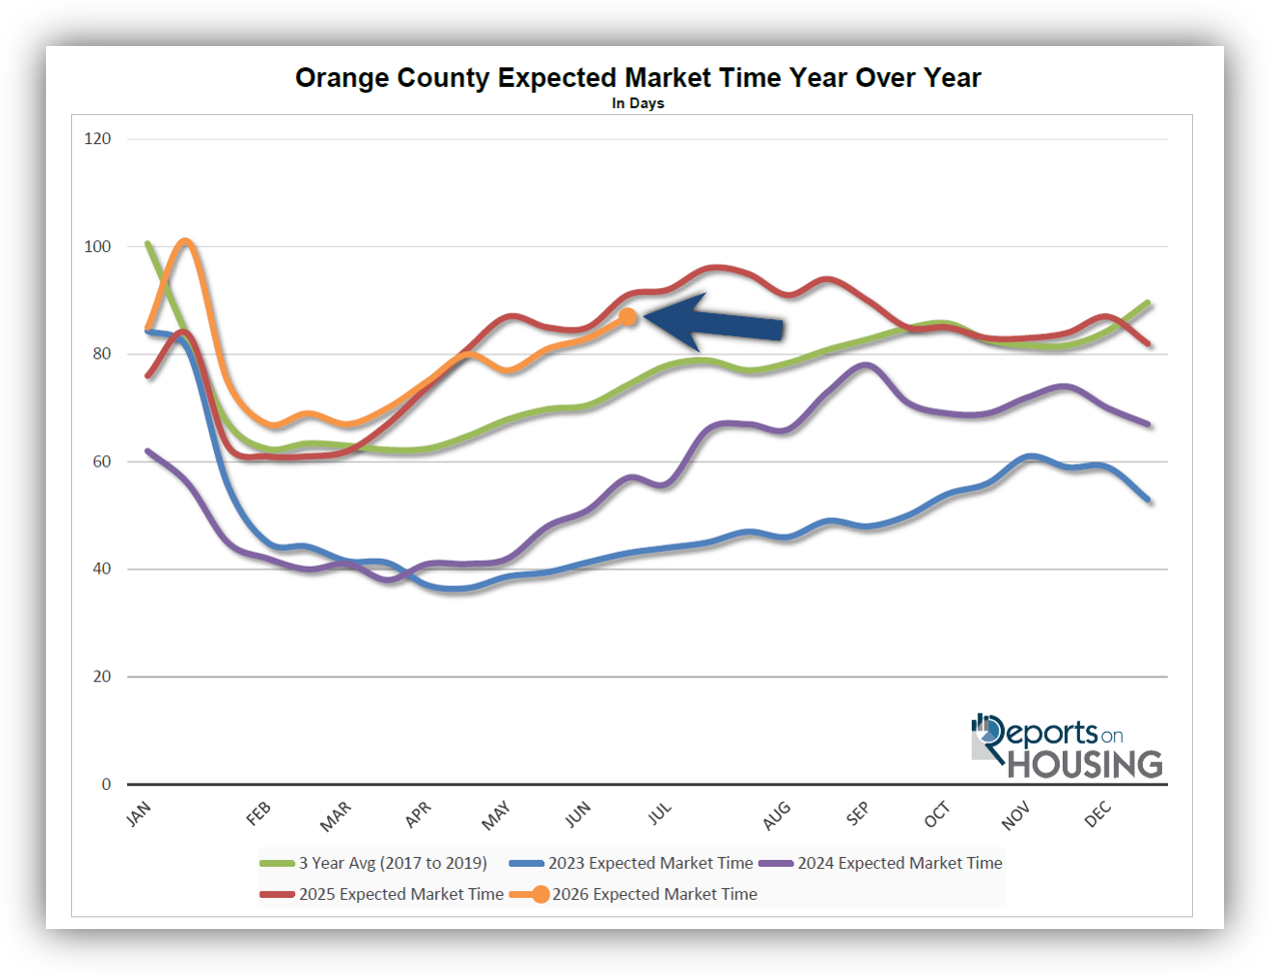
In the past two weeks, the market slowed by four days.
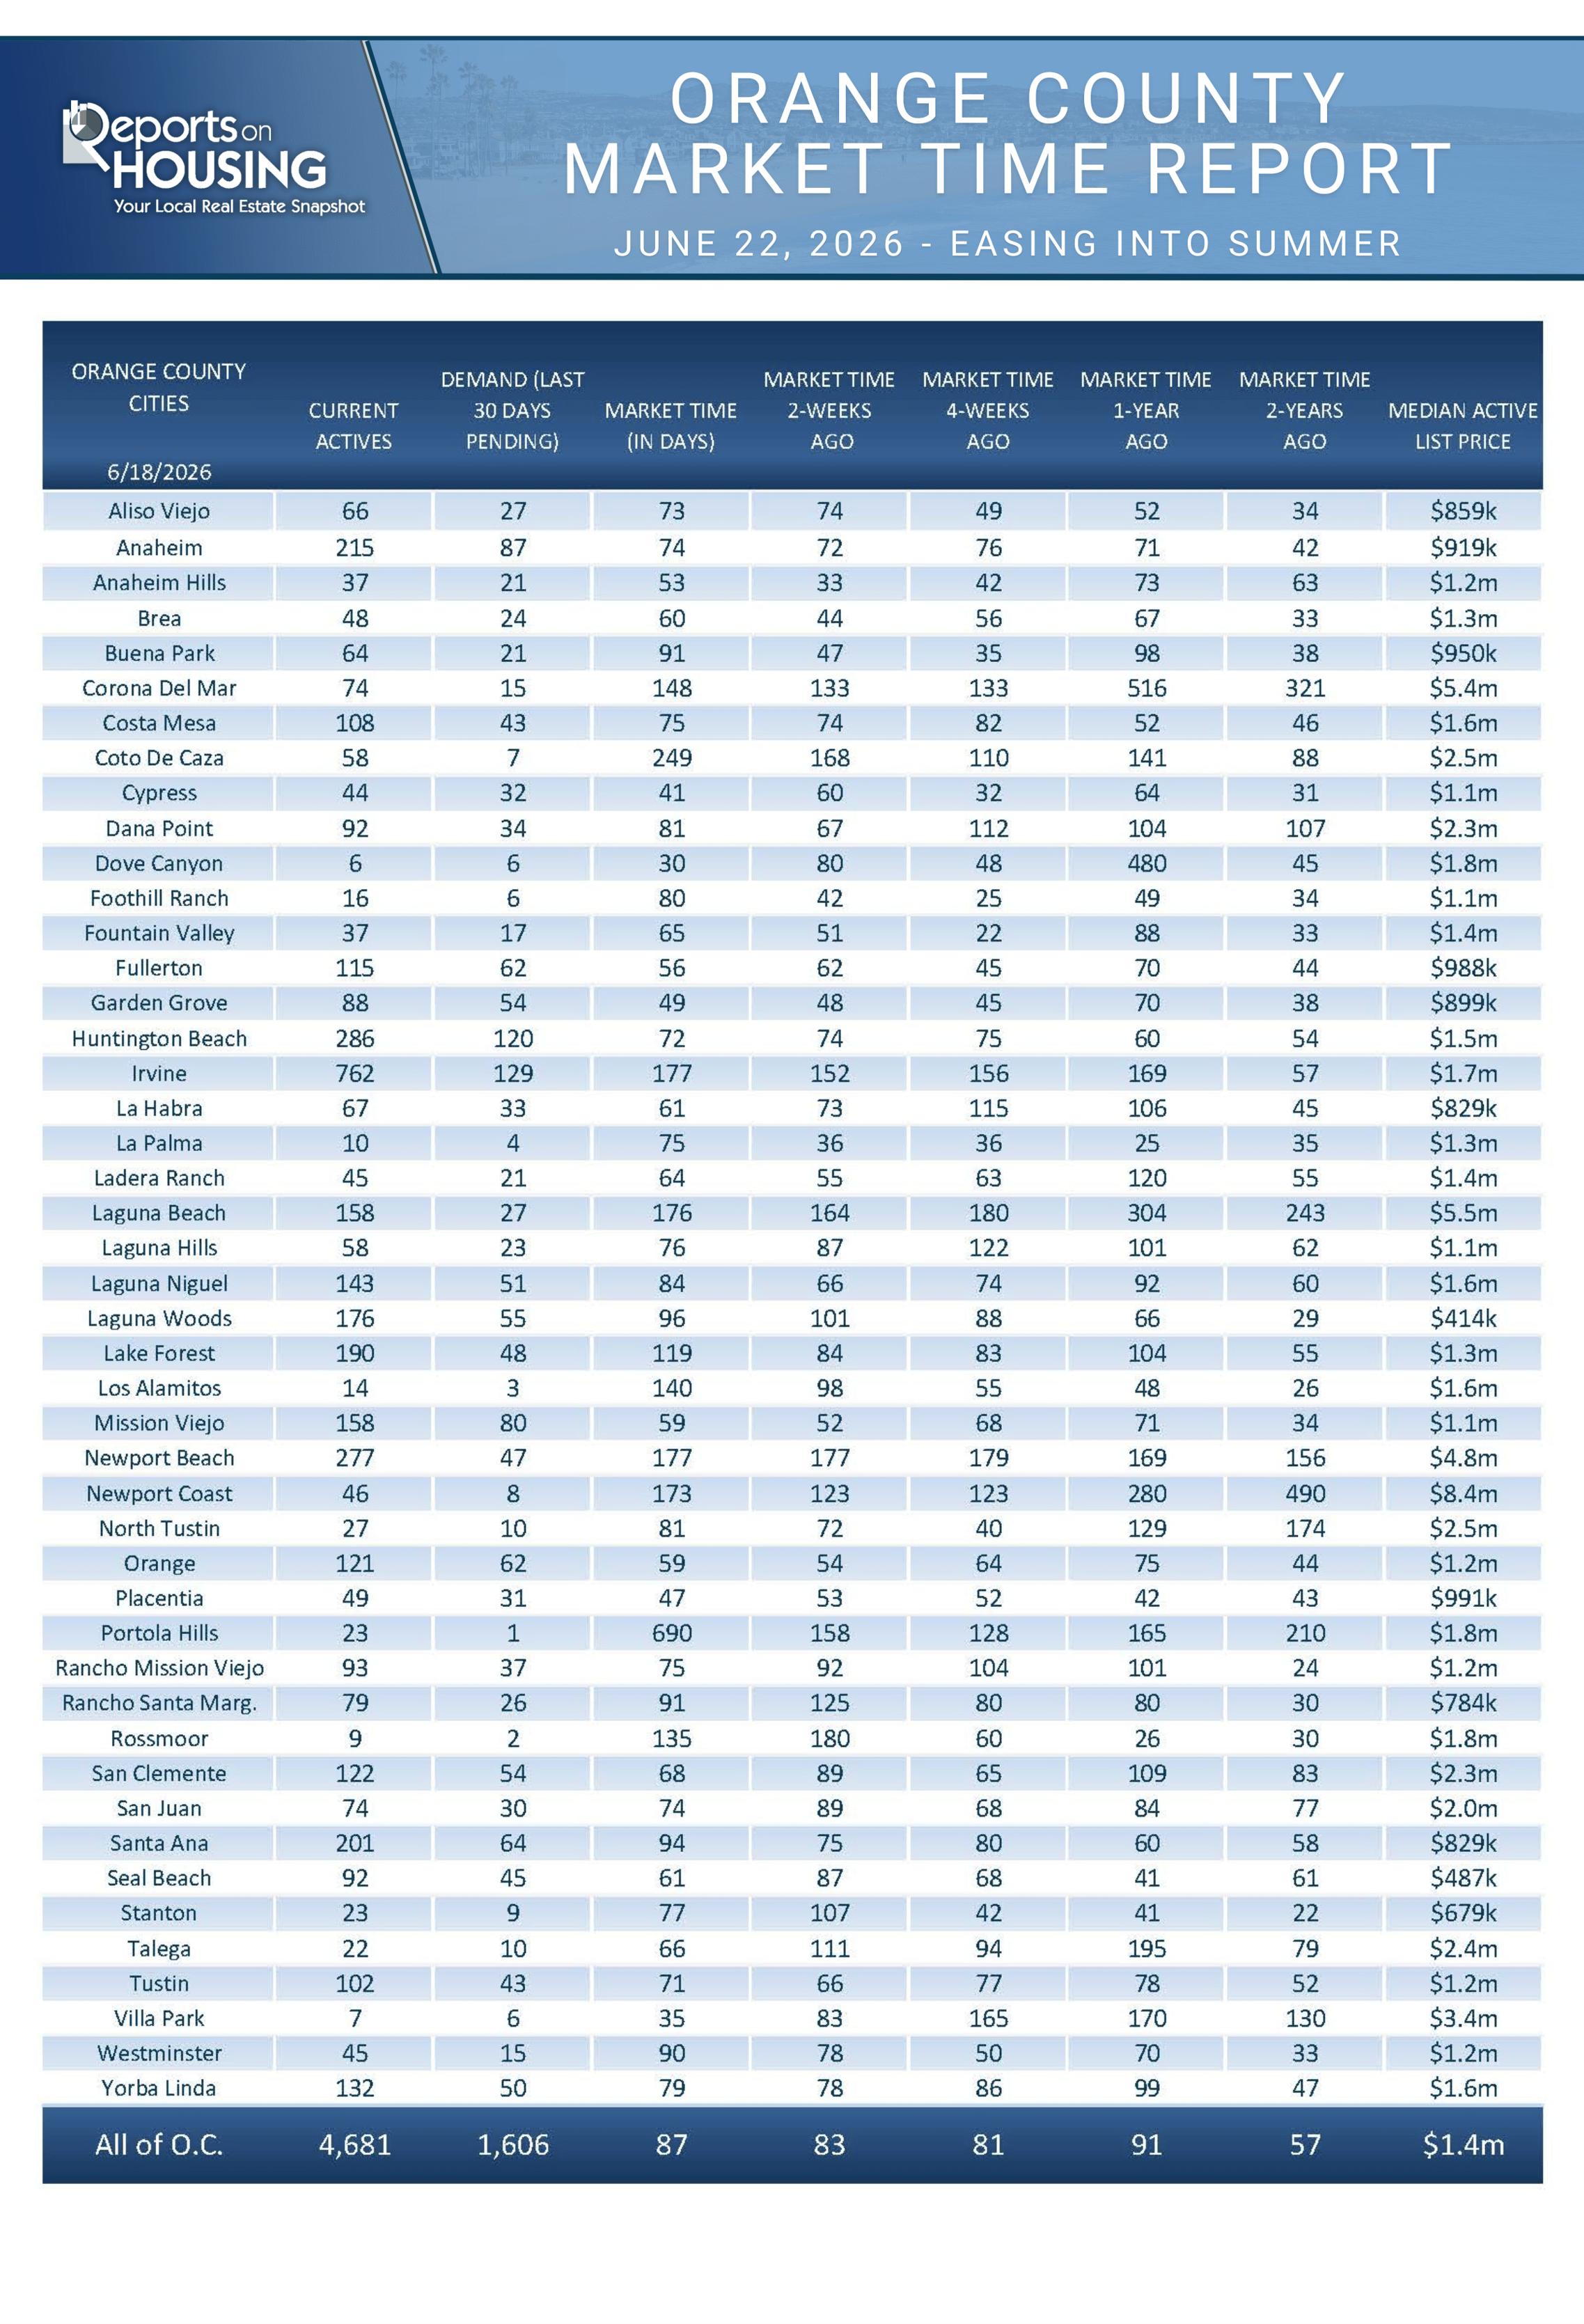
With the supply of available homes rising by 130 homes, up 3%, and demand falling by 31 pending sales, down 2%, the Expected Market Time (the number of days it takes to sell all Orange County listings at the current buying pace) increased from 83 to 87 days in the past couple of weeks.
Last year, it was 91 days, similar to today. The 3-year average before COVID (2017 to 2019) was 75 days, faster than today.
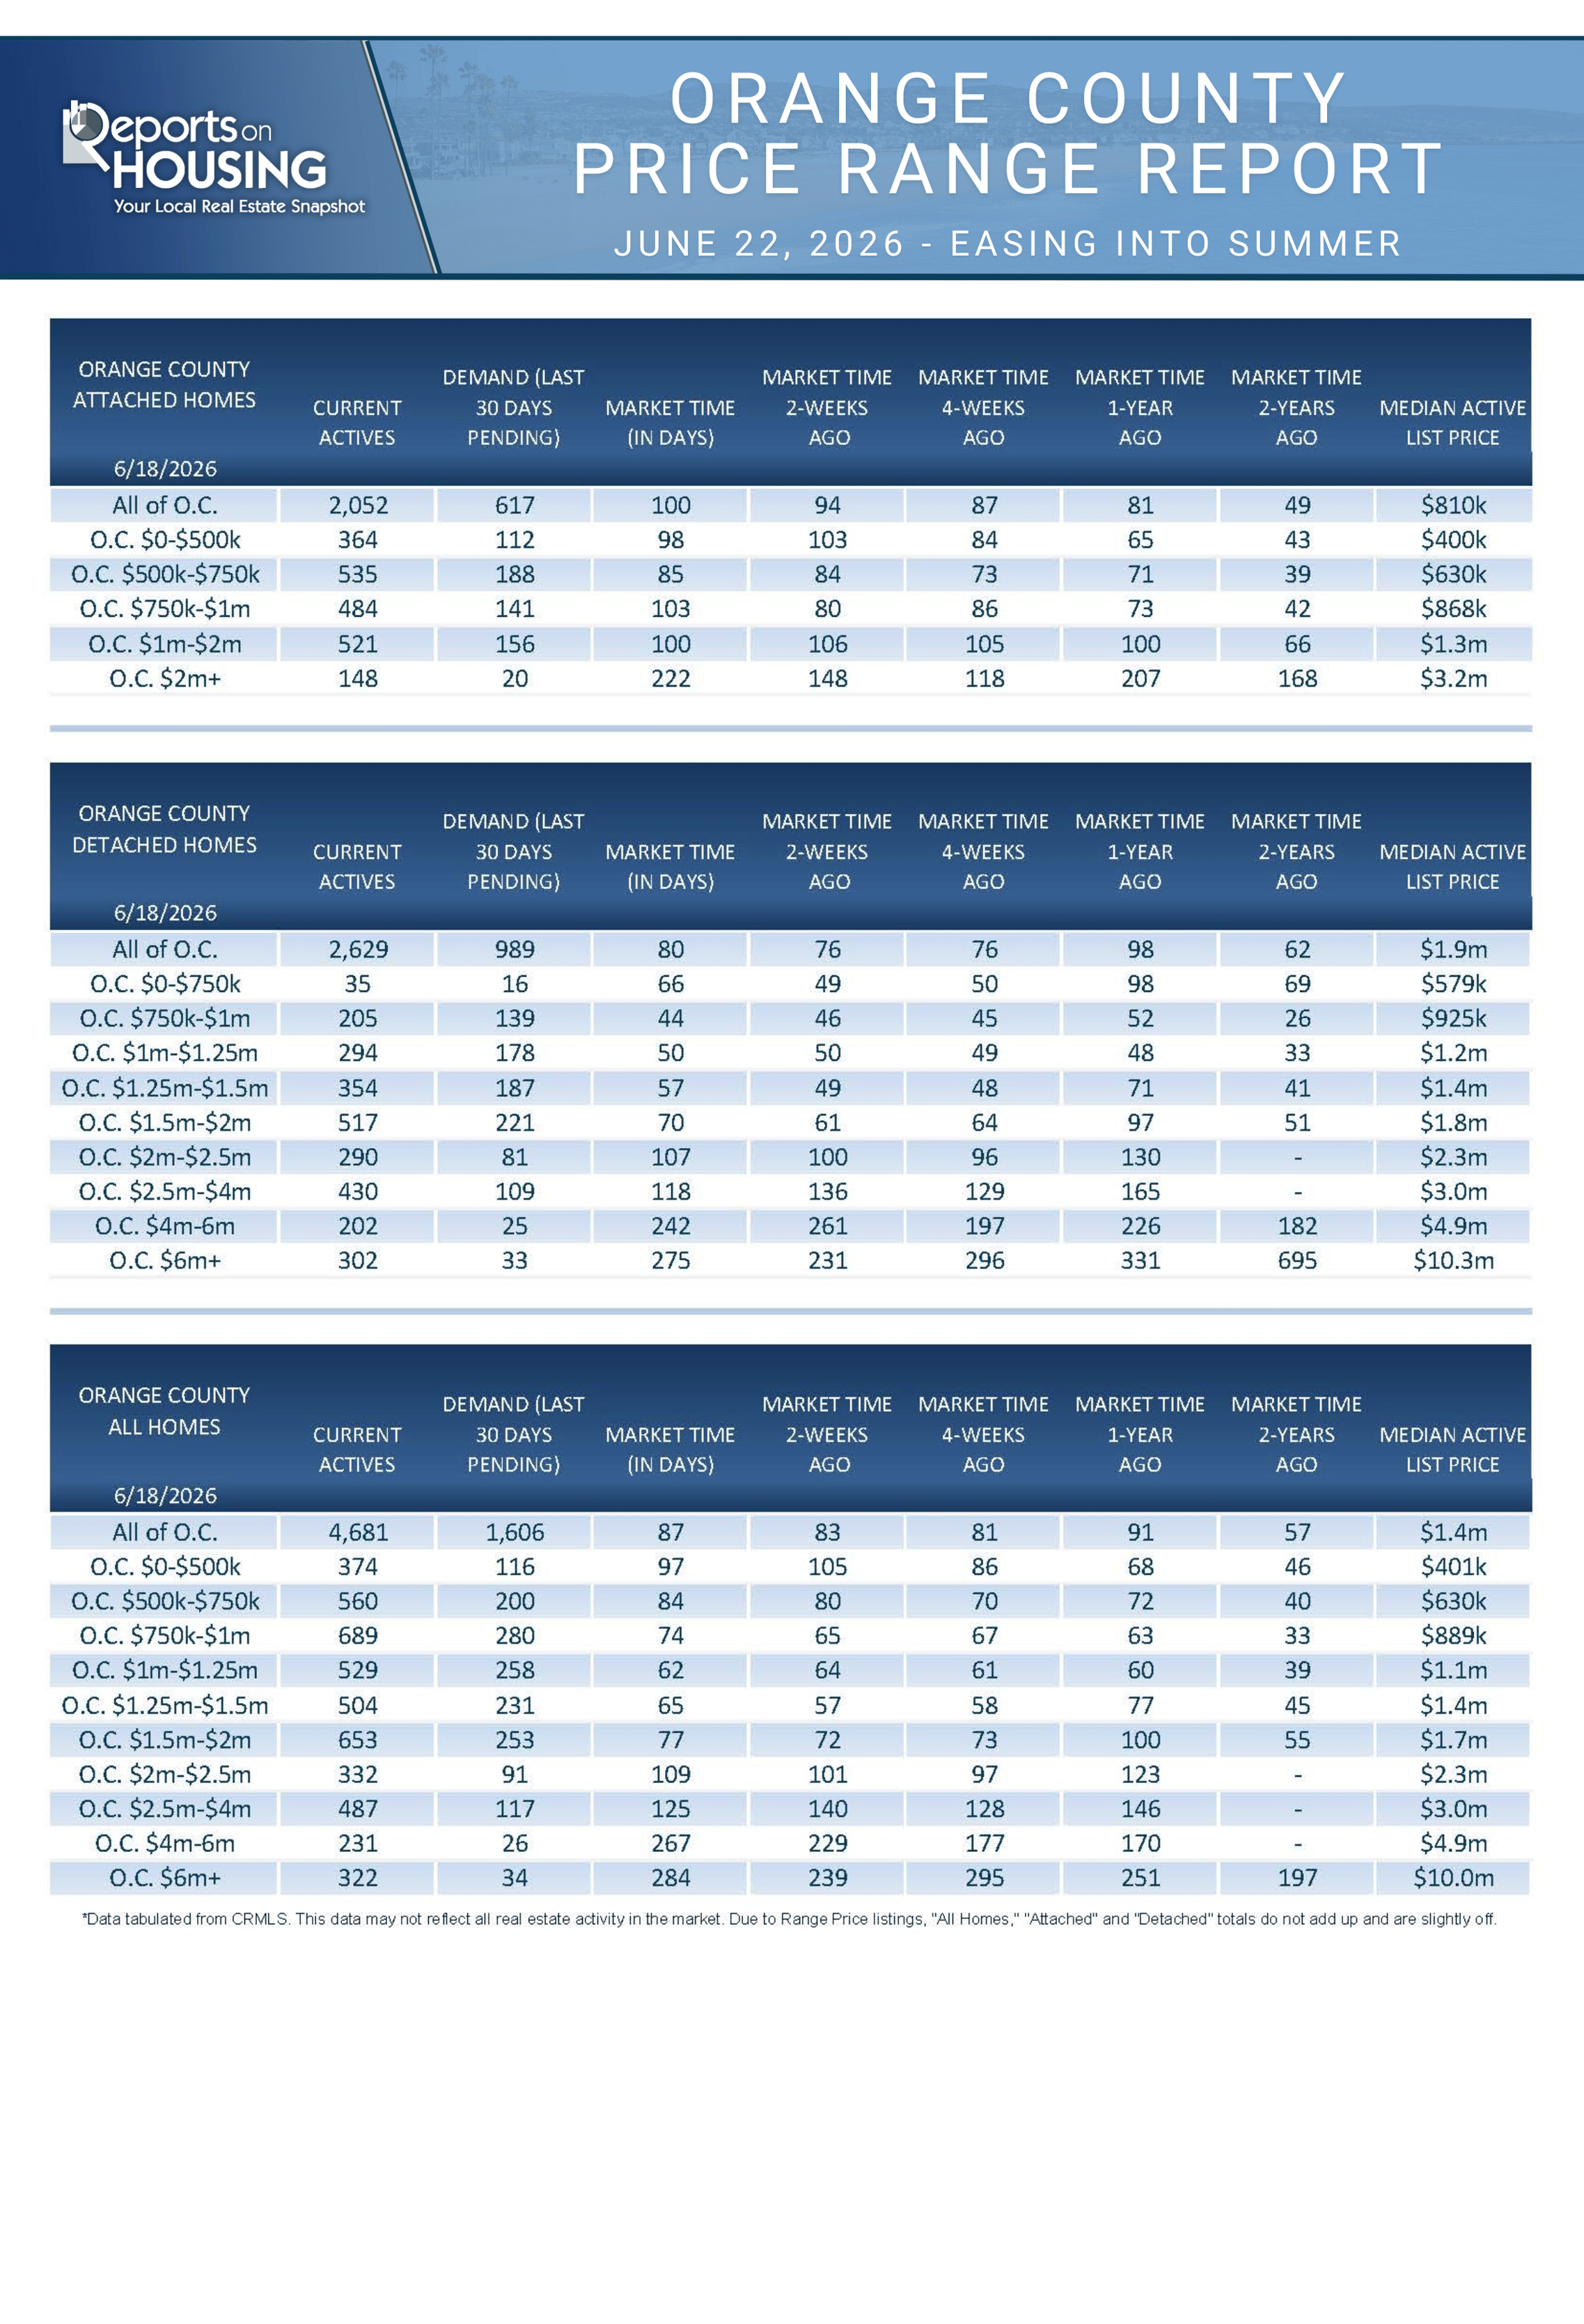
The Expected Market Time for condominiums and townhomes increased from 94 to 100 days in the past two weeks. It was 81 days last year. For detached homes, the Expected Market Time remained increased from 76 to 80 days. It was 98 days a year ago. The detached-home market remains significantly faster than the attached-home market.
Luxury End
The luxury market did not change much in the past couple of weeks.
In the past couple of weeks, the luxury inventory of homes priced above $2.5 million (the top 10% of the Orange County housing market) decreased from 1,047 to 1,040, down 7, or 1%. Luxury demand remained unchanged at 177 pending sales. With supply falling slightly and demand unchanged, the Expected Market Time for luxury homes priced above $2.5 million decreased from 177 to 176 days. The luxury market will slow from here.
Year over year, the active luxury inventory is down by 198 homes (-16%), and luxury demand is up by 5 pending sales (+3%). Last year’s Expected Market Time was 216 days, slower than today.
In the past two weeks, the Expected Market Time for homes priced between $2.5 million and $4 million decreased from 140 to 125 days. For homes priced between $4 million and $6 million, the Expected Market Time increased from 229 to 267 days. For homes priced above $6 million, the Expected Market Time increased from 239 to 284 days. Luxury is at 176 days overall. At this pace, a seller would be looking at becoming a pending sale around December 2026.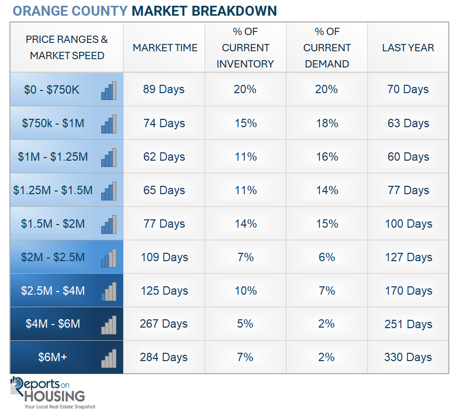
Orange County Housing Summary
- INVENTORY: The active listing inventory in the past couple of weeks increased by 130 homes, up 3%, and now stands at 4,681. Last year, there were 4,894 homes on the market, 213 additional homes, or 5% more. The 3-year average before COVID (2017 to 2019) was 6,633, which is 42% higher. From January through May, 27% fewer homes came on the market than the 3-year average before COVID (2017 to 2019), 4,937 fewer. There were 489 fewer than last year, 1,556 more than in 2024, and 3,280 more than in 2023.
- DEMAND: Buyer demand, the number of pending sales over the prior month, decreased by 31 in the past two weeks, down 2%, and now stands at 1,606. Demand peaked 6 weeks ago. Last year, there were 1,614 pending sales, nearly unchanged. The 3-year average before COVID (2017 to 2019) was 2,679, which is 67% higher than today.
- MARKET TIME: With the inventory rising and demand falling, the Expected Market Time, the number of days to sell all Orange County listings at the current buying pace, increased from 83 to 87 days in the past couple of weeks. Last year, it was 91 days, similar to today. The 3-year average before COVID (2017-2019) was 75 days, faster than today.
- LUXURY: In the past two weeks, the Expected Market Time for homes priced between $2.5 million and $4 million decreased from 140 to 125 days. For homes priced between $4 million and $6 million, the Expected Market Time increased from 229 to 267 days. For homes priced above $6 million, the Expected Market Time increased from 239 to 284 days.
- DISTRESSED HOMES: Short sales and foreclosures combined, comprised only 0.1% of all listings and 0.6% of demand. One foreclosure and six short sales are available today in Orange County, bringing the total of distressed homes on the active market to seven, down five from two weeks ago. Last year, 12 distressed homes were on the market, similar to today.
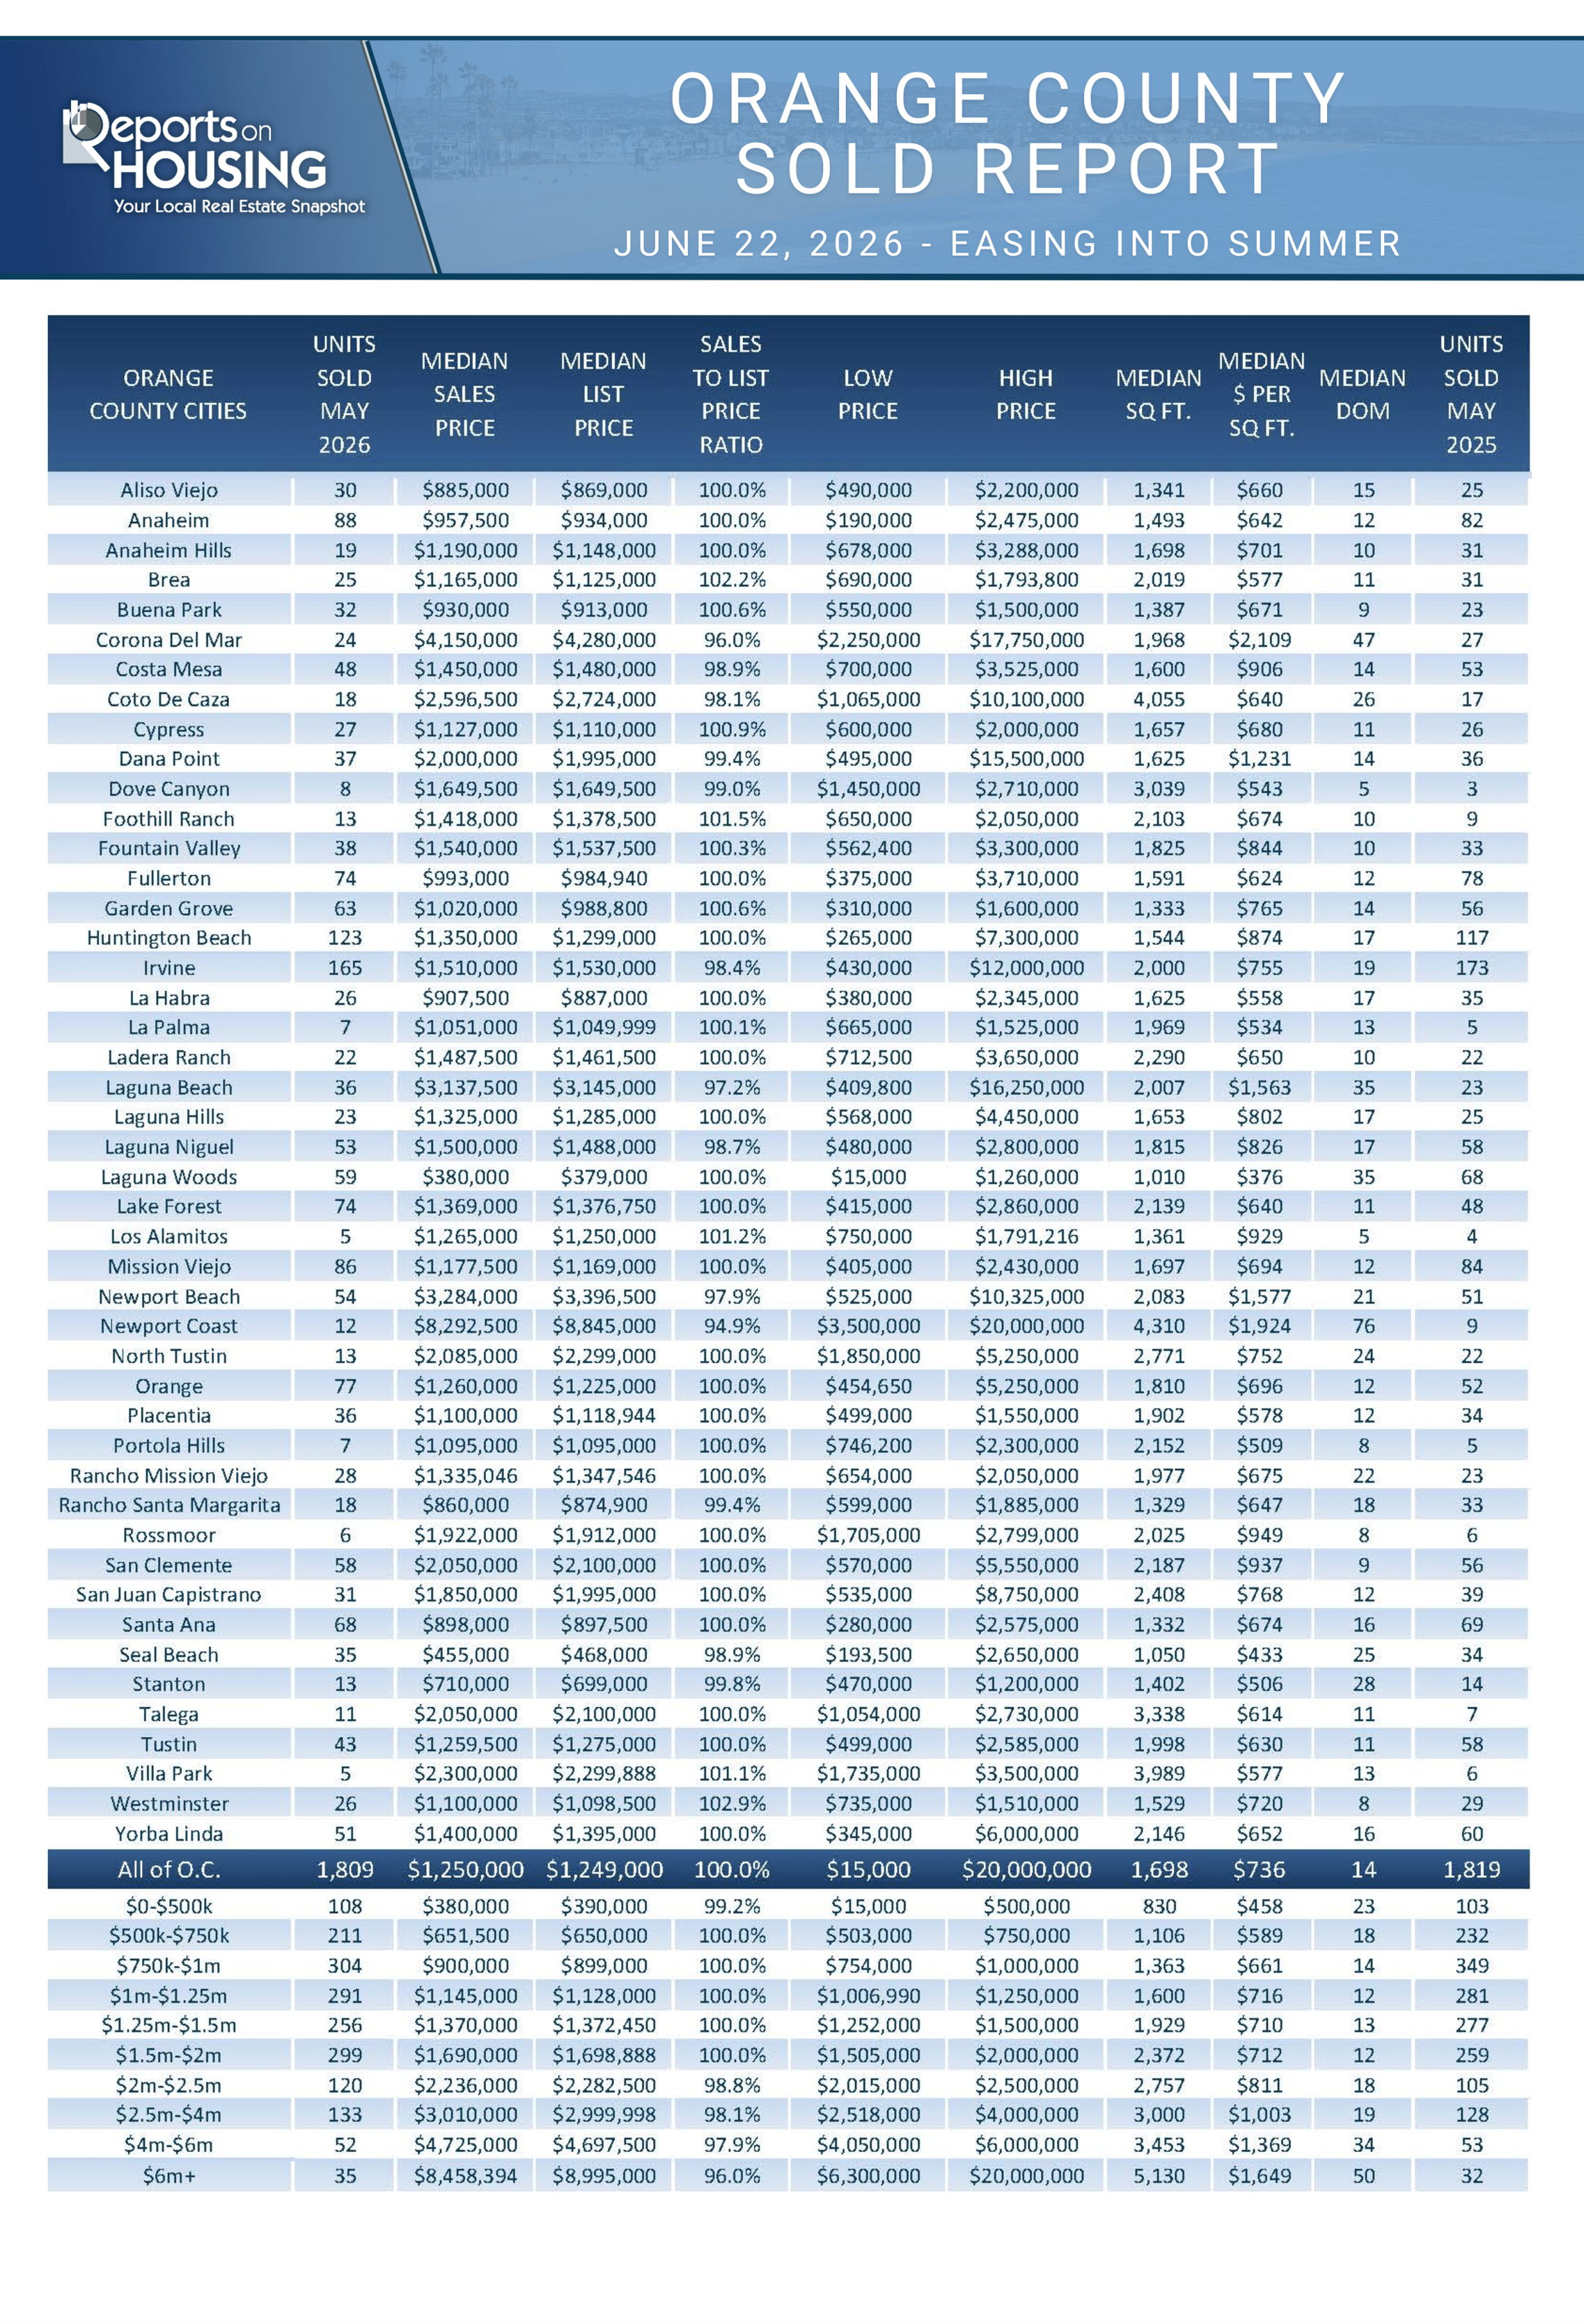
- CLOSED SALES: There were 1,809 closed residential resales in May, down 1% compared to May 2025’s 1,819 sales, and down 4% from April 2026. The sales-to-list price ratio in Orange County was 100.0%. Foreclosures accounted for 0.1% of all closed sales, and short sales accounted for 0.1% as well. That means that 99.8% of all sales were sellers with equity.
Have a great week.
Sincerely,
Steven Thomas
Quantitative Economics and Decision Sciences
Copyright 2026—Steven Thomas, Reports On Housing—All Rights Reserved. This report may not be reproduced in whole or in part without express written permission from the author.

Jeanette Nelson
| Nelson Group Real Estate | Keller Williams Realty Huntington Beach
or another way