Published July 7, 2026
Orange County Housing Report: Housing Values Plateau

Orange County Housing Report: Housing Values Plateau
July 6, 2026
After nearly 4 years of rates above 6%, Orange County home values have stalled amid low demand and rising inventory
A Balanced Market
Home values in Orange County are up only 1.2% over the past year.
Despite a once-in-a-century pandemic, buyers lined up in long lines that wrapped around the block, respectfully maintaining the recommended 5-foot distance behind the buyer in front of them, donning masks, and waiting their turn to tour a home that had just hit the market hours earlier. The catalyst was record-low mortgage rates and a historically low supply of available homes. Many homes permitted buyers to view a home for a couple of hours on Saturday and agreed to respond to all offers on the following Tuesday. It was common for sellers to receive 20, 30, or sometimes more offers to purchase. A bidding war ensued. To become the winning bidder, buyers often stretch above the asking price. It seemed that the sky was the limit on prices. As a result, home values skyrocketed higher, up 8.2% in 2020, 15.2% in 2021, and 10.5% in 2022.
The Federal Reserve stepped in and started raising rates in March 2022. In response to higher rates, the Zillow Home Price Index shows values initially dropped by 5.4% from June 2022 through March 2023. In July 2023, buyer demand (a snapshot of the number of new pending sales over the prior month) was down 42% compared to the 3-year average before the pandemic (2017-2019), but the inventory was down 66%. Home values rose 7.6% in 2023, even though January through March were negative months. In July 2024, demand was down 39% from the 3-year average, and inventory was down 54%. Home values increased by 8.3%. In July 2025, demand was 42% lower than the 3-year average, and the inventory was 27% lower. With additional supply and very similar year-over-year demand, home prices were flat, down 0.2% year over year. 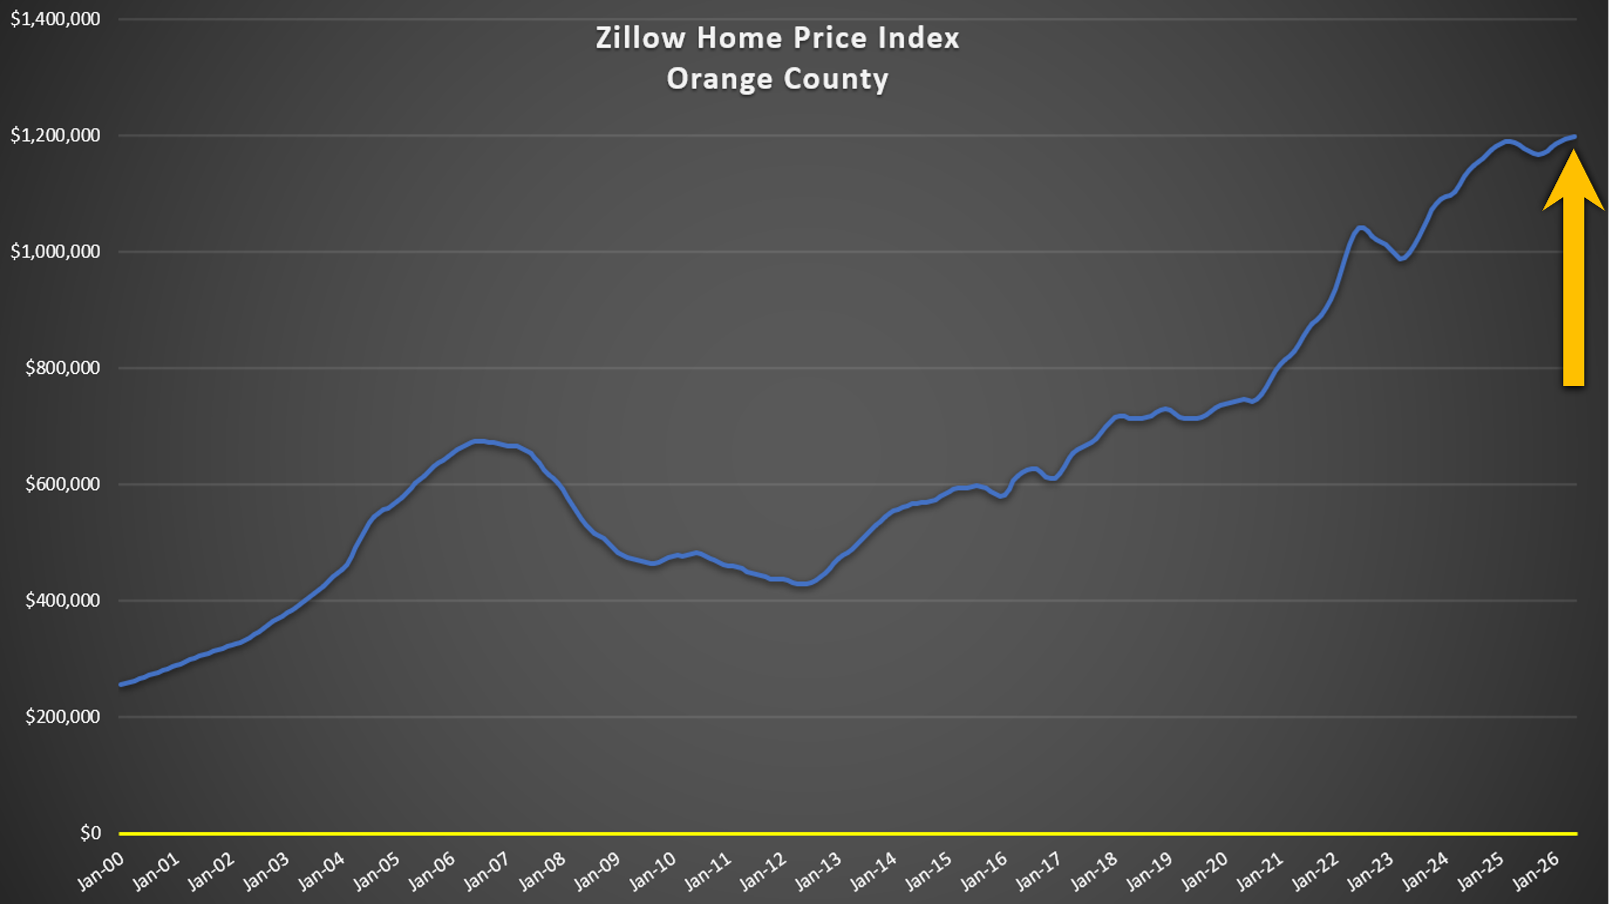
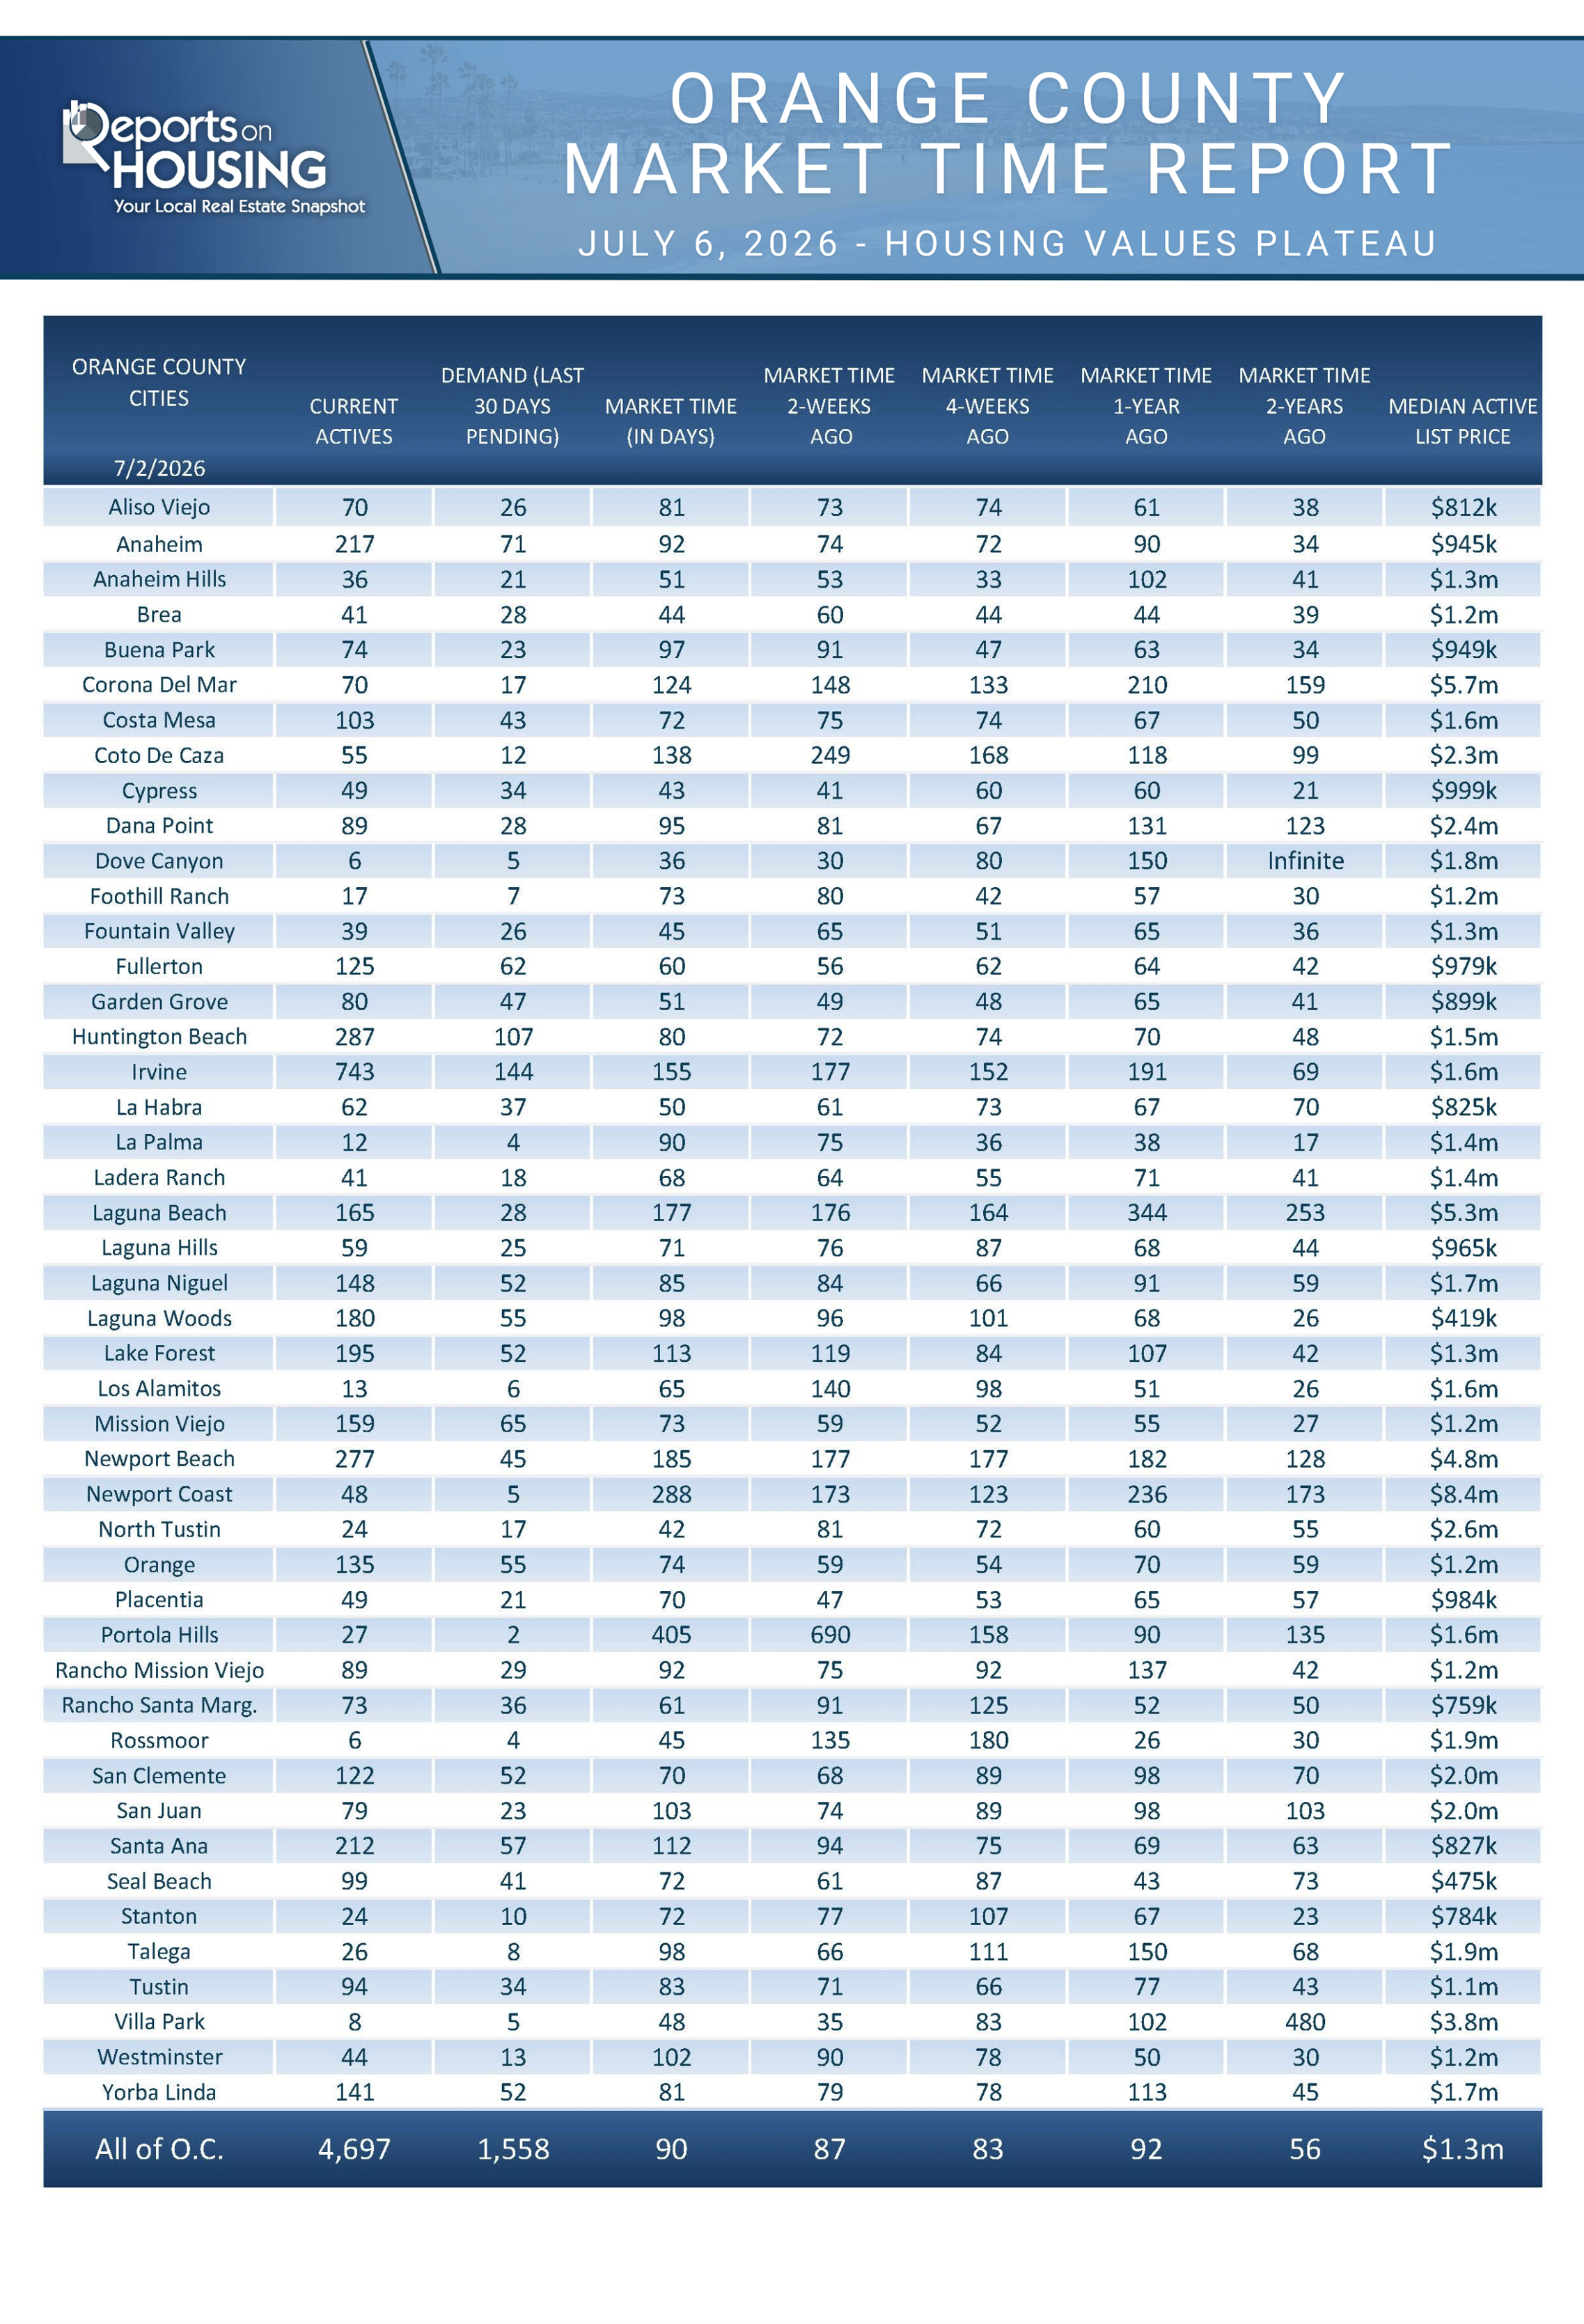
Home values rose in 2023 despite much higher mortgage rates. The very low demand (1,560 pending sales in July) was matched by a chronically low supply of available homes (2,276 in July). In 2024, demand remained at 2023’s very low levels (1,624 pending sales in July), yet the increase in the inventory (3,052 in July) was not enough to stop the rise in values. In 2025, low demand persisted (1,565 pending sales), and the inventory finally rose enough (4,817 in July) to stall home price appreciation. The additional supply tilted the scale away from a seller’s market. The scale is now fairly balanced, not really favoring sellers or buyers. It has reached a plateau. Demand is currently at 1,558, nearly identical to last year. The supply of available homes is 4,697 today, down 120, or 3%, from a year ago. That’s not much of a difference.
Looking at home values in Orange County monthly shows a bit more volatility. In 2025, they were up from January through March, turned negative from April through September, and then were positive to close out the year. Overall, they were flat, changing only slightly from month to month. This year, home values have been positive for the first five months, up 0.5% in January and February, 0.4% in March, 0.1% in April, and only 0.06% in May. From here, it looks as if values will remain flat overall in 2026.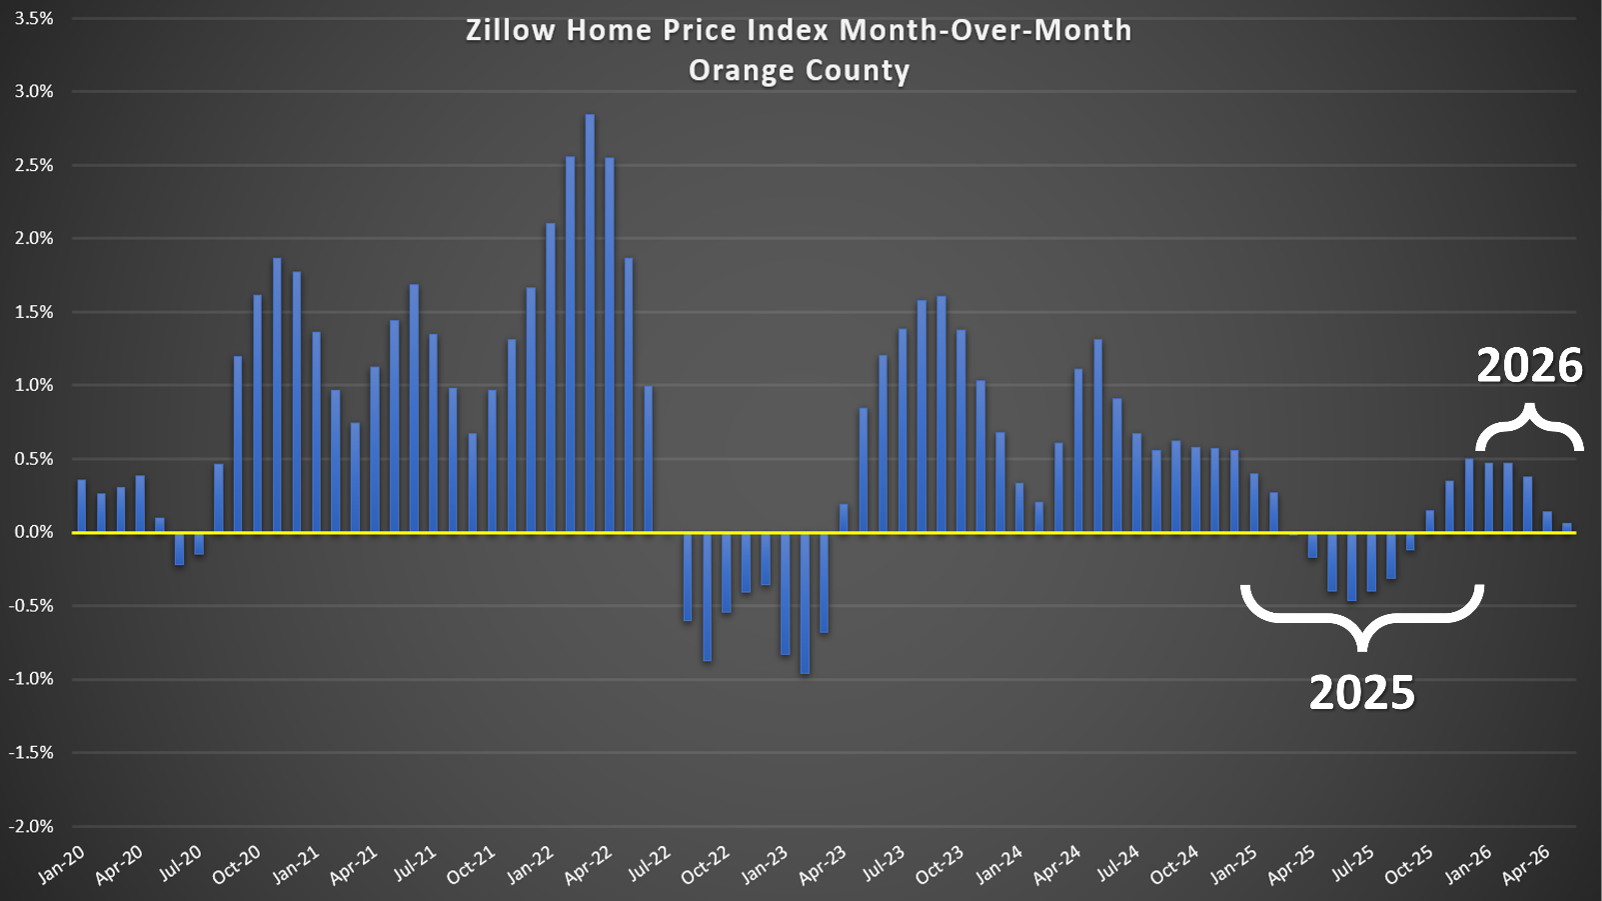
At this point, mortgage rates have proven to be the gas pedal for the housing market. With supply elevated relative to 2023 and 2024, demand increases when rates drop below 6.5% and move towards 6%, as home affordability improves. That is the equivalent of stepping on the gas pedal, and the housing market speeds up. Demand rises, pushing the market further in the seller’s favor. Rates dropped below 6.5% in September of last year, and they remained there through April, with very few exceptions. That explains home values turning positive from October 2025 to May of this year. With rising inflation due to the conflict in Iran, mortgage rates have popped above 6.5% and have remained there since mid-May. That is like letting off the gas. Values start to decline, and the housing market slows.
Any changes in supply will also alter market speed and whether the market favors buyers or sellers. There have been fewer homes available this year compared to last year since May (currently 2% lower than July 2025). If the inventory levels fall considerably below last year's, the pressure on prices to rise increases. If it climbs considerably higher, as it did in 2025, the pressure for prices to fall increases.
For now, the housing market is balanced. Orange County housing values have plateaued.
Active Listings
In anticipation of the 4th of July holiday weekend, the inventory was nearly unchanged.
The active listing inventory increased by 16 homes over the past two weeks, nearly unchanged, to 4,697, its highest level since last September. The inventory stalls at the start of July due to the holiday, with fewer sellers coming to market, knowing that housing is going to temporarily pause. In addition, many sellers place their homes on “HOLD” for a week to partake and enjoy all the festivities. The inventory will resume its climb and reach its peak in either late July or August.
Last year, the inventory was at 4,817 homes, 3% more than today, with 120 additional homes. The 3-year average before COVID (2017 through 2019) was 6,708, an additional 2,011 homes, or 43% more.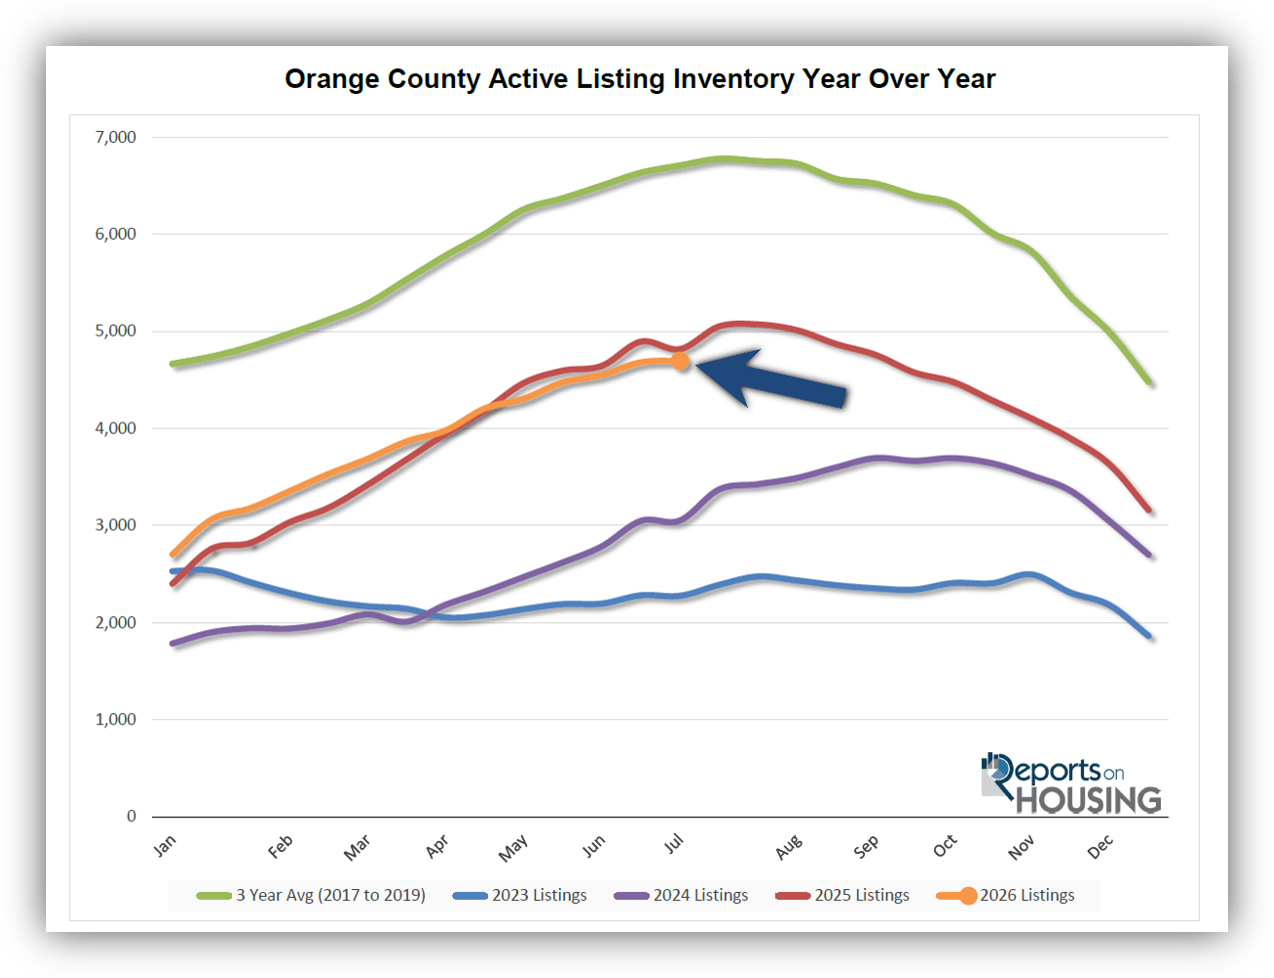
Homeowners continue to “hunker down” in their homes, unwilling to move because of their current, underlying, locked-in, low fixed-rate mortgage. This trend has been easing from the lows established in 2023. Through June, 15,943 homes were placed on the market in Orange County, 6,197 fewer than the 3-year average before COVID (2017-2019), 28% less. In 2025, 16,622 homes entered the market (4% more), compared with 14,386 in 2024 (10% fewer) and 12,346 in 2023 (23% fewer). Slightly fewer homes have been coming to market this year than last.
Demand
Demand decreased by 3% in the past couple of weeks.
Demand, a snapshot of the number of new pending sales over the prior month, decreased from 1,606 to 1,558 in the past couple of weeks, down 48 pending sales, or 3%. Like supply, demand stalls for the 4th of July holiday. Nearly everyone looks forward to the summer pause, including buyers. They will resume their efforts and, demand will stabilize over the next couple of weeks.
Last year, demand was 1,565, with 7 additional pending sales (nearly unchanged). The 3-year average before COVID (2017 to 2019) was 2,582 pending sales, 66% more than today, or an additional 1,024.
As the Federal Reserve has indicated, it is essential to monitor all economic releases for signs of a slowdown. These releases can cause mortgage rates to rise or fall, depending on how they compare with market expectations. It is also important to monitor any developments in the Iran conflict and its impact on the oil market, and ultimately inflation, which can also cause mortgage rates to rise or fall. Next week, the Consumer Price Index (CPI) and Producer Price Index (PPI) will be released, two crucial inflation indicators. In addition, retail sales will be released.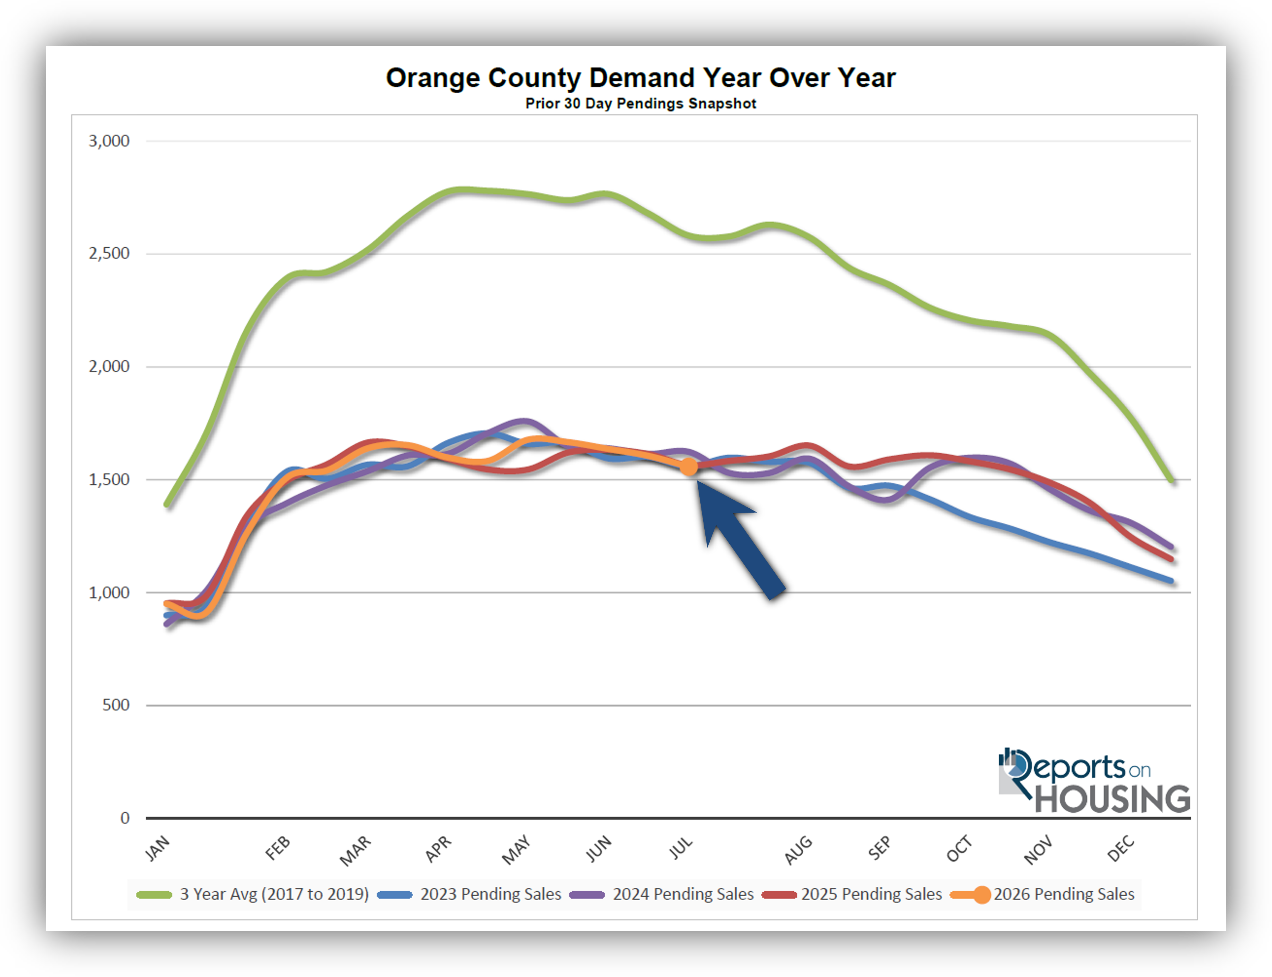
Expected Market Time
In the past two weeks, the market slowed by three days.
With the supply of available homes rising by 16 homes, nearly unchanged, and demand falling by 48 pending sales, down 3%, the Expected Market Time (the number of days it takes to sell all Orange County listings at the current buying pace) increased from 87 to 90 days in the past couple of weeks, its highest level since the mid-January 101-day reading.
Last year, it was 92 days, similar to today. The 3-year average before COVID (2017 to 2019) was 78 days, faster than today.
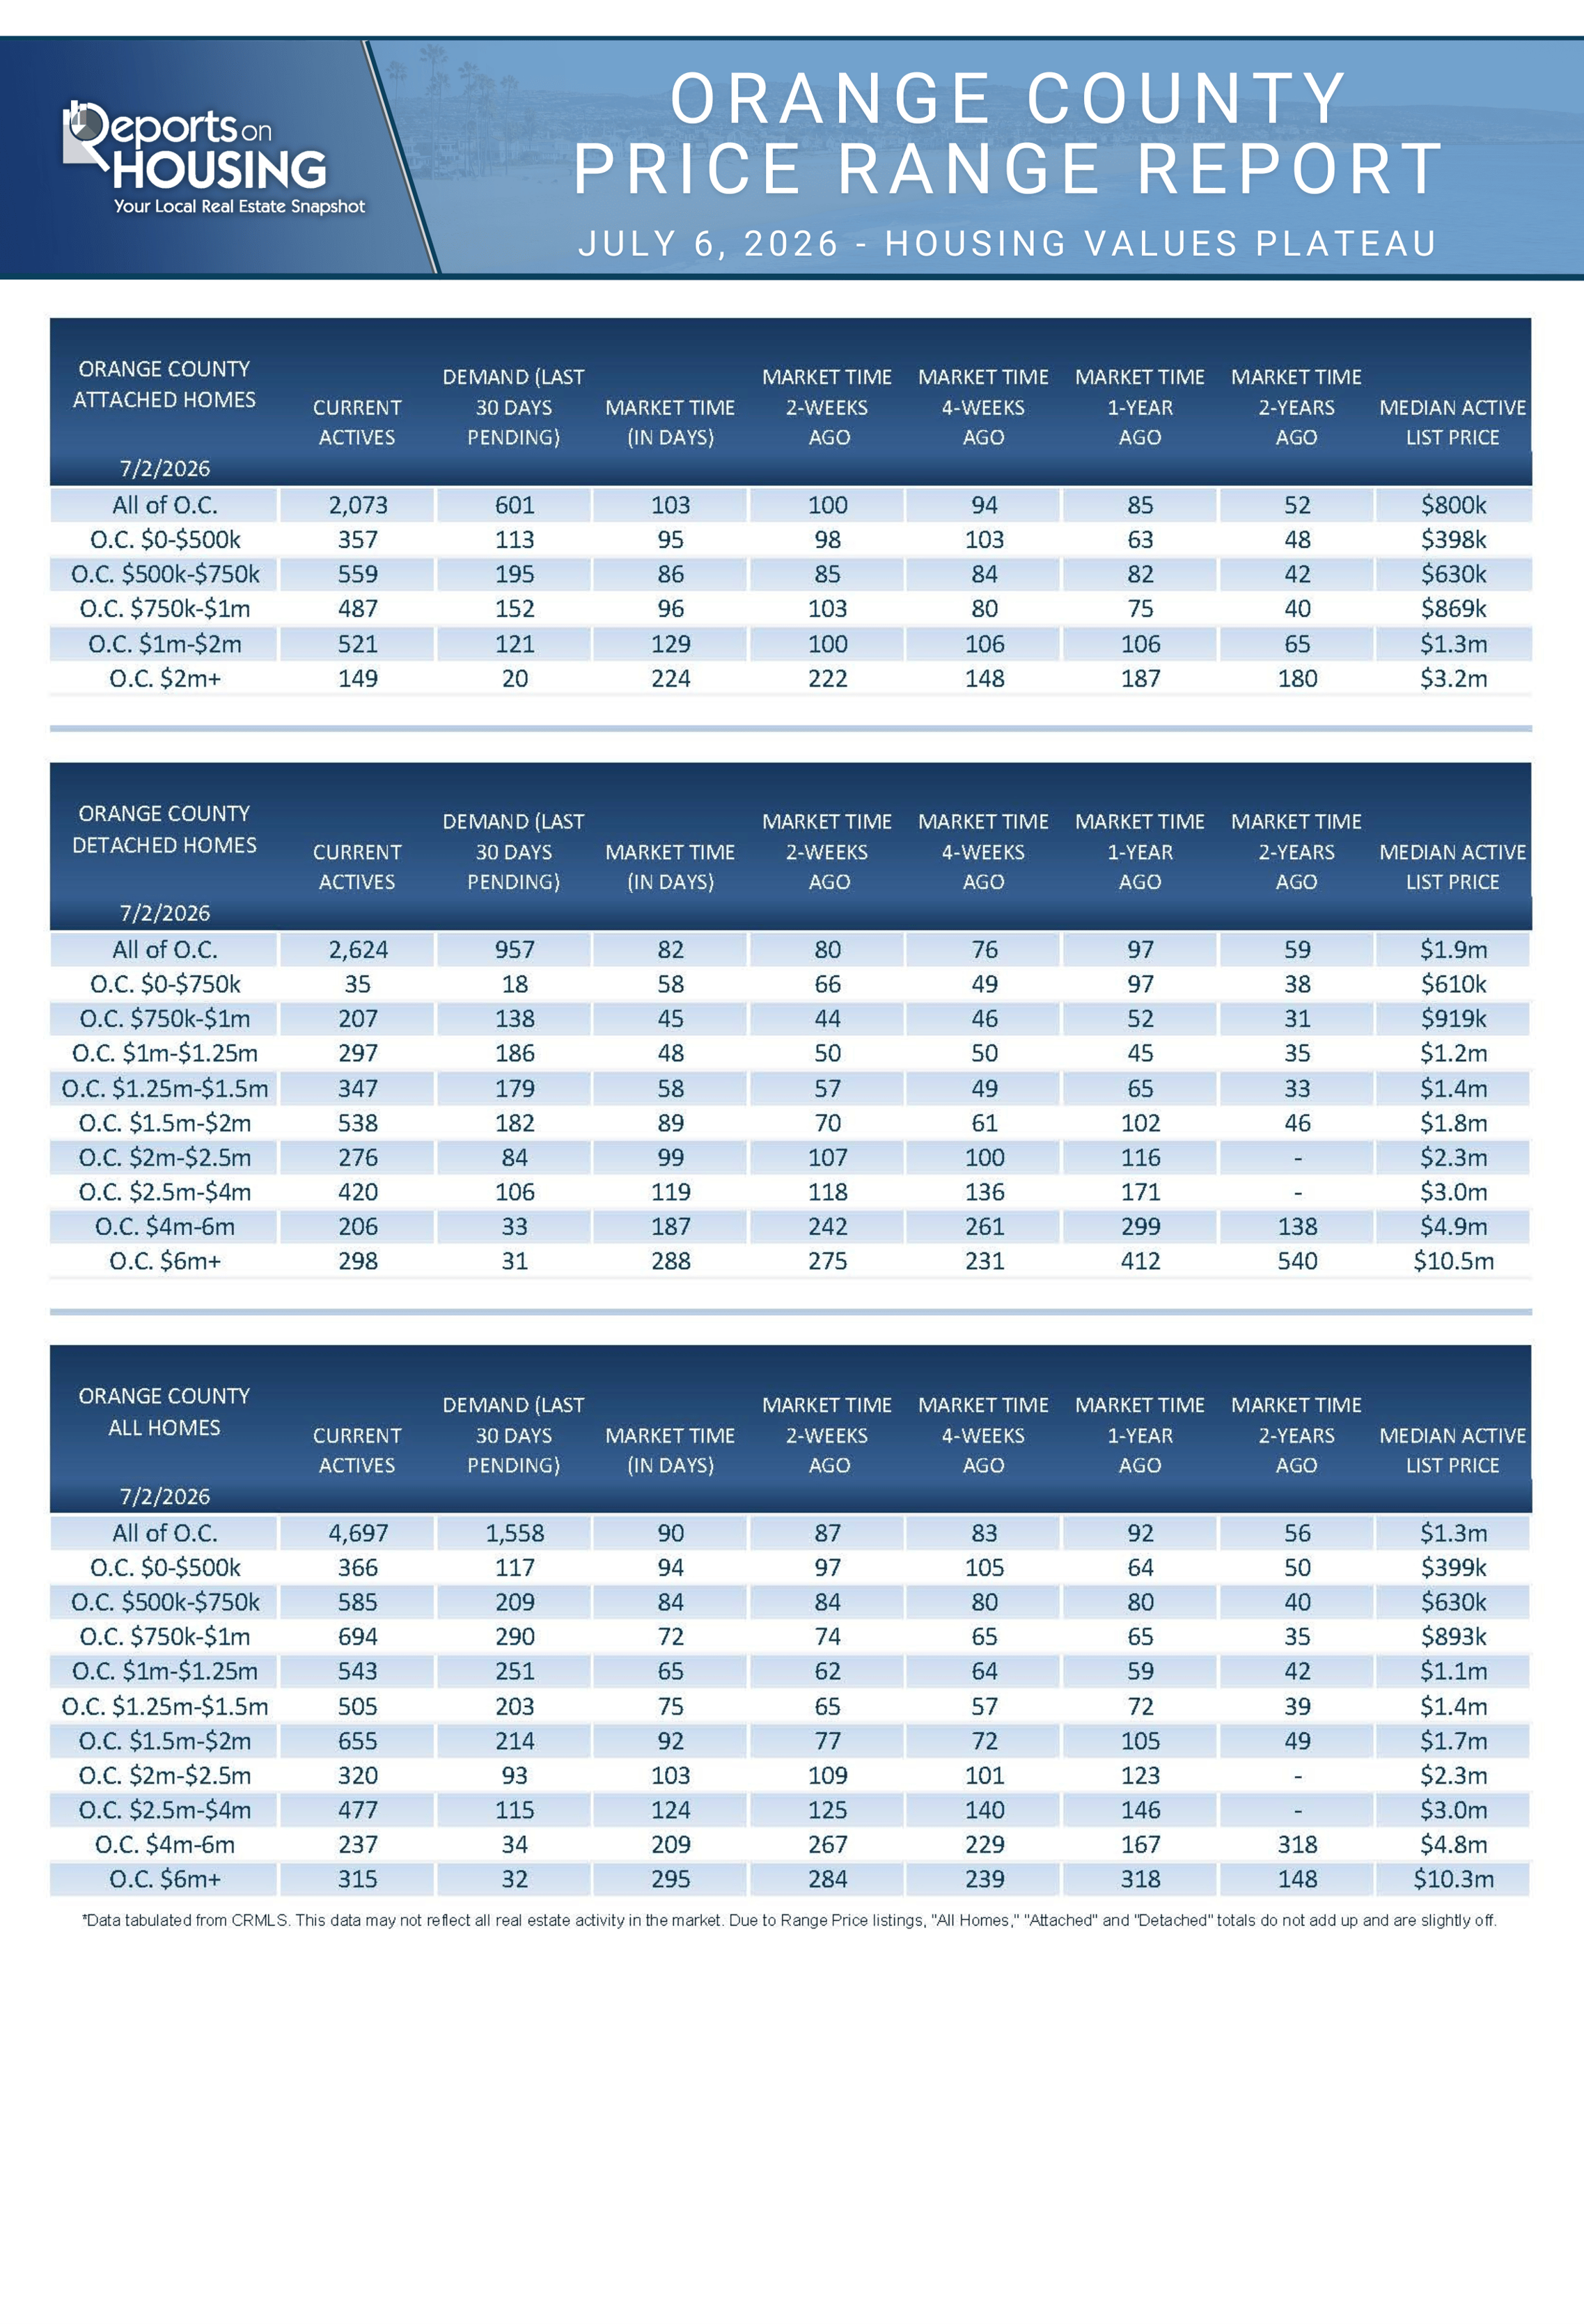
The Expected Market Time for condominiums and townhomes increased from 100 to 103 days in the past two weeks. It was 85 days last year. For detached homes, the Expected Market Time increased from 80 to 82 days. It was 97 days a year ago. The detached-home market remains significantly faster than the attached-home market. 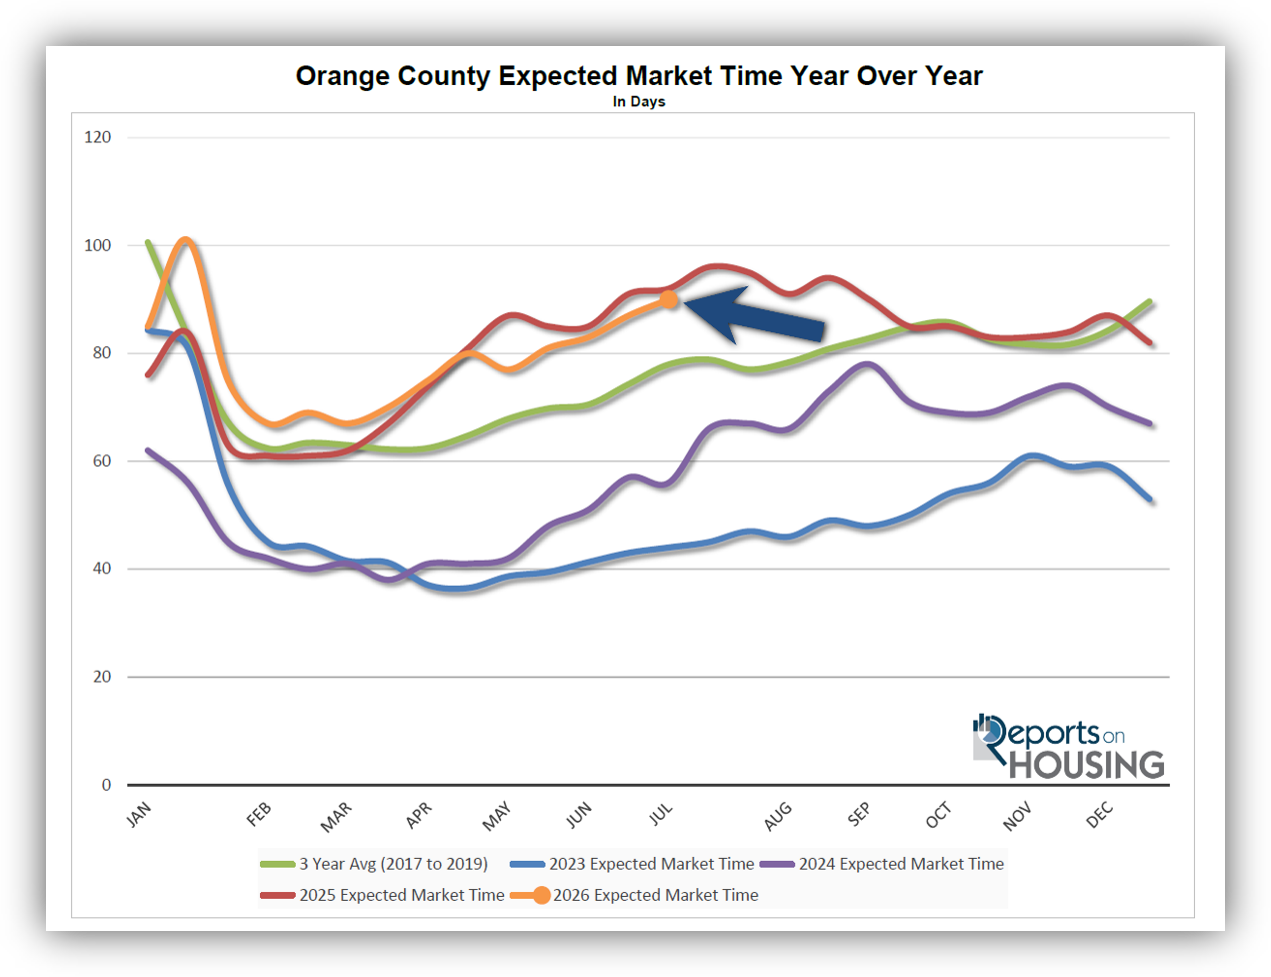
Luxury End
The luxury market improved slightly in the past couple of weeks.
In the past couple of weeks, the luxury inventory of homes priced above $2.5 million (the top 10% of the Orange County housing market) decreased from 1,040 to 1,029, a decline of 11, or 1%. Luxury demand increased from 177 to 181, up 4, or 2%. With supply falling slightly and demand rising, the Expected Market Time for luxury homes priced above $2.5 million decreased from 176 to 171 days. The luxury market typically slows from here.
Year over year, the active luxury inventory is down by 206 homes (-17%), and luxury demand is up by 21 pending sales (+13%). Last year’s Expected Market Time was 232 days, slower than today.
In the past two weeks, the Expected Market Time for homes priced between $2.5 million and $4 million decreased from 125 to 124 days. For homes priced between $4 million and $6 million, the Expected Market Time decreased from 267 to 209 days. For homes priced above $6 million, the Expected Market Time increased from 284 to 295 days. Luxury is at 171 days overall. At this pace, a seller would be looking at becoming a pending sale around December 2026.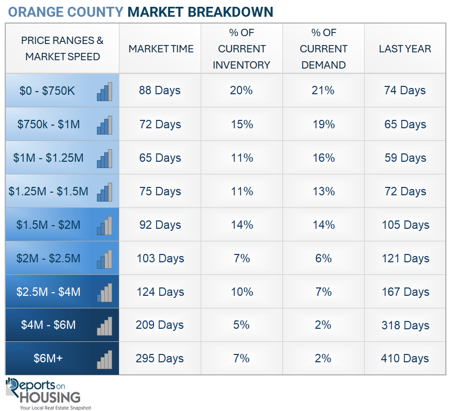
Orange County Housing Summary
• INVENTORY: The active listing inventory in the past couple of weeks increased by 16 homes, nearly unchanged, and now stands at 4,697. Last year, there were 4,817 homes on the market, 120 additional homes, or 3% more. The 3-year average before COVID (2017 to 2019) was 6,708, which is 43% higher. From January through June, 28% fewer homes came on the market than the 3-year average before COVID (2017 to 2019), 6,197 fewer. There were 679 fewer than last year, 1,557 more than in 2024, and 3,597 more than in 2023.
• DEMAND: Buyer demand, the number of pending sales over the prior month, decreased by 48 in the past two weeks, down 3%, and now stands at 1,558. Last year, there were 1,565 pending sales, nearly unchanged. The 3-year average before COVID (2017 to 2019) was 2,582, which is 66% higher than today.
• MARKET TIME: With the inventory unchanged and demand falling, the Expected Market Time, the number of days to sell all Orange County listings at the current buying pace, increased from 87 to 90 days in the past couple of weeks. Last year, it was 92 days, similar to today. The 3-year average before COVID (2017-2019) was 78 days, faster than today.
• LUXURY: In the past two weeks, the Expected Market Time for homes priced between $2.5 million and $4 million decreased from 125 to 124 days. For homes priced between $4 million and $6 million, the Expected Market Time decreased from 267 to 209 days. For homes priced above $6 million, the Expected Market Time increased from 284 to 295 days.
• DISTRESSED HOMES: Short sales and foreclosures combined, comprised only 0.2% of all listings and 0.4% of demand. Four foreclosures and six short sales are available today in Orange County, bringing the total of distressed homes on the active market to ten, up three from two weeks ago. Last year, 14 distressed homes were on the market, similar to today.
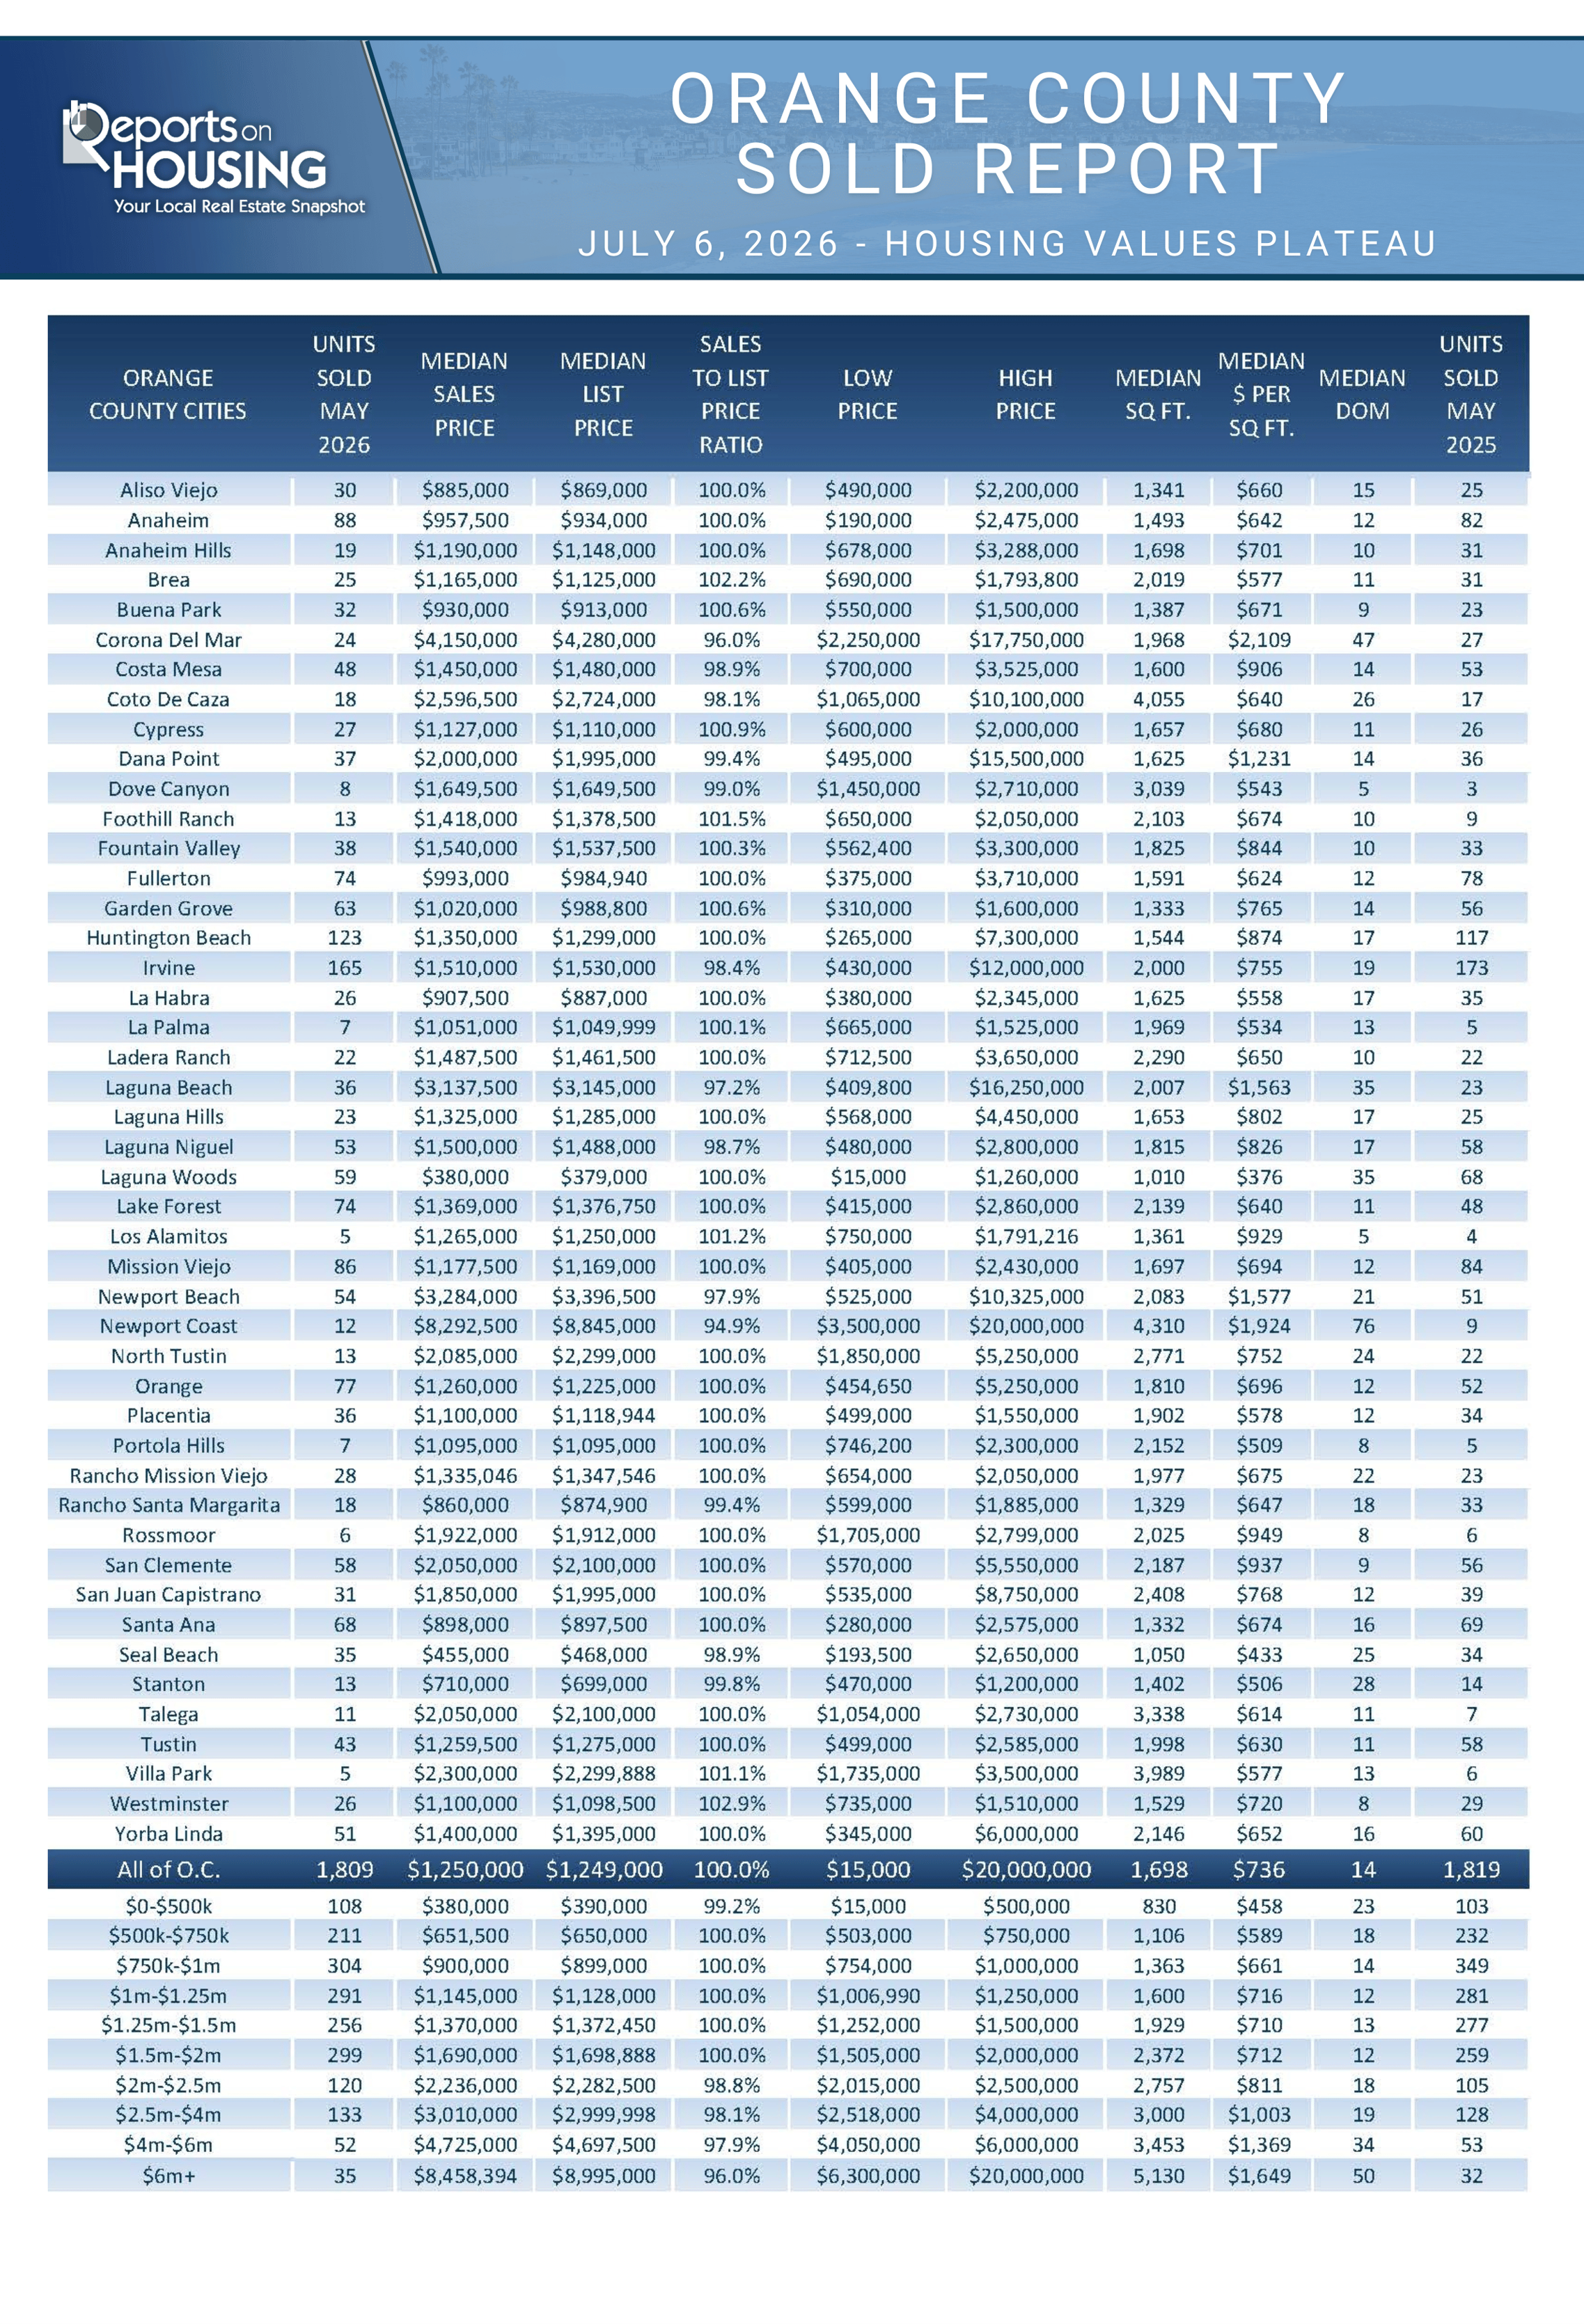
• CLOSED SALES: There were 1,809 closed residential resales in May, down 1% compared to May 2025’s 1,819 sales, and down 4% from April 2026. The sales-to-list price ratio in Orange County was 100.0%. Foreclosures accounted for 0.1% of all closed sales, and short sales accounted for 0.1% as well. That means that 99.8% of all sales were sellers with equity.
Have a great week.
Sincerely,
Steven Thomas
Quantitative Economics and Decision Sciences
Copyright 2026—Steven Thomas, Reports On Housing—All Rights Reserved. This report may not be reproduced in whole or in part without the author's express written permission.