Orange County market
30-Second market updates
The Orange County single-family home market, one month at a glance: active homes, median price, days on market, months of supply, and sold price compared with list price.
Published monthly by Jeanette Nelson of Jeanette Nelson Real Estate (formerly Nelson Group Real Estate), Keller Williams Realty in Huntington Beach. Months of supply is how long it would take to sell every active listing if no new ones came on the market: 0 to 4 months is a seller's market, 5 to 7 is balanced, and 8 to 12 is a buyer's market.
June 2026
Orange County single-family homes, compared with last month and the same month last year.
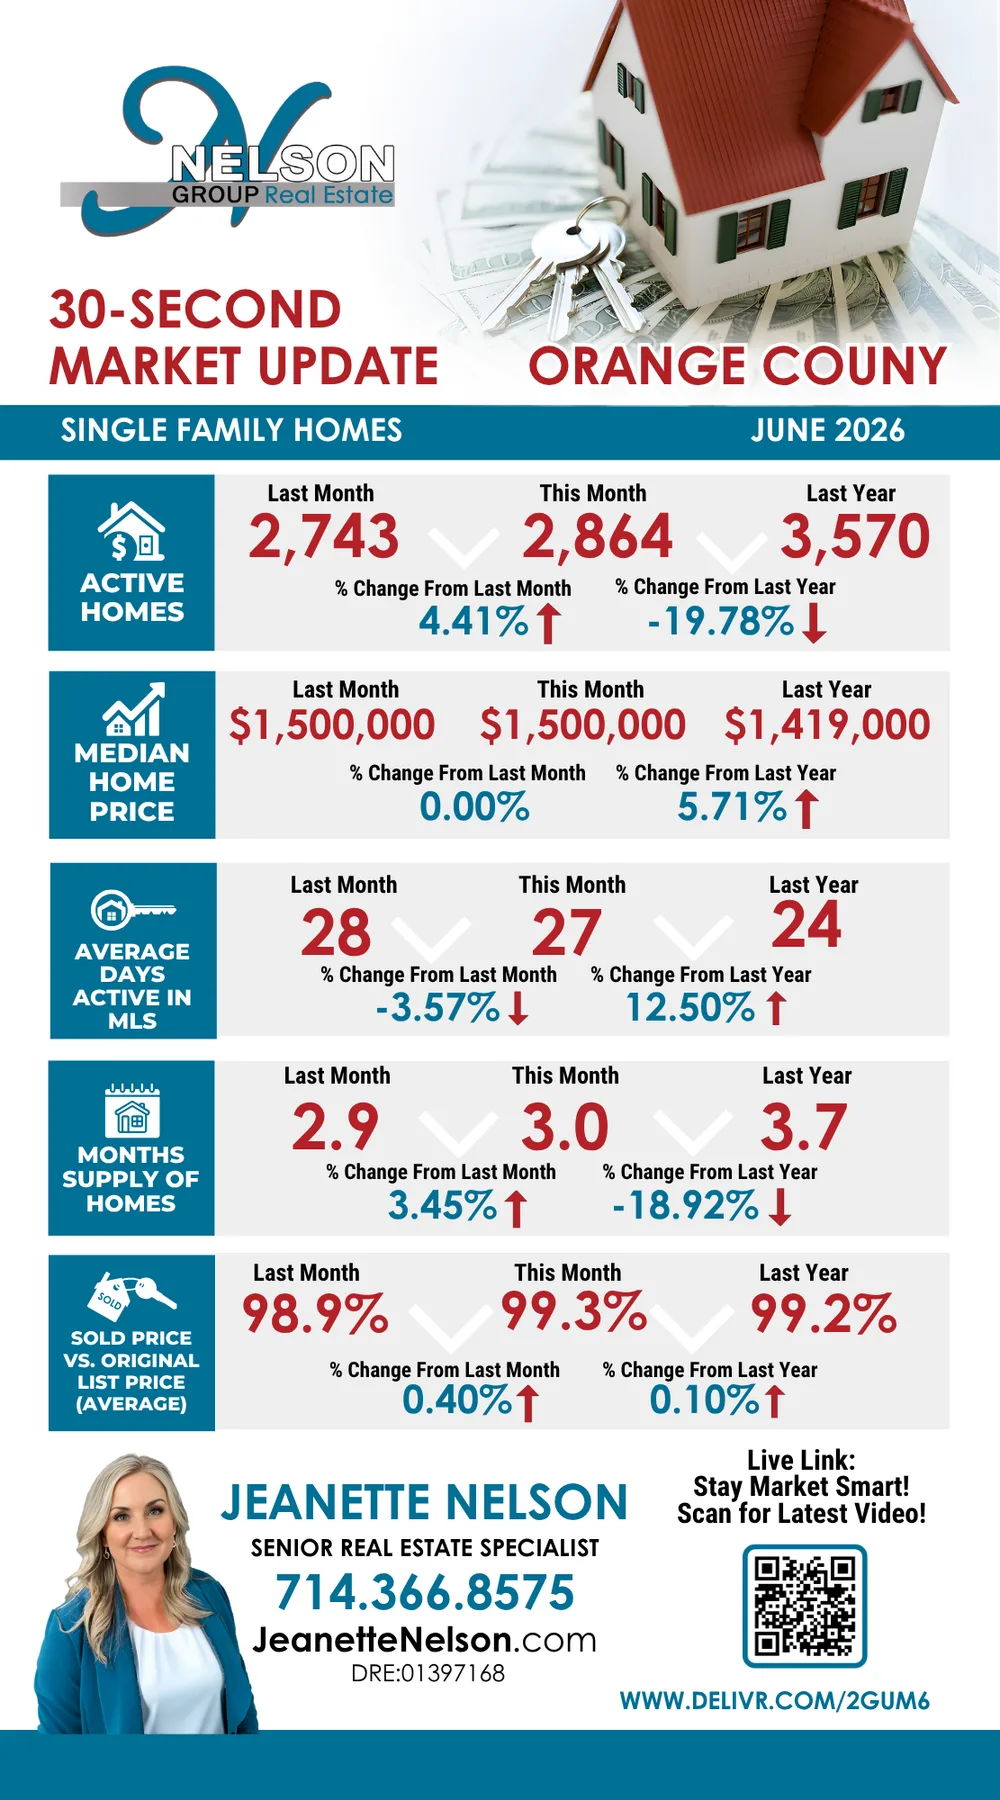
- Active homes
- 2,864
Last month 2,743 (+4.41%) · Last year 3,570 (-19.78%) - Median home price
- $1,500,000
Last month $1,500,000 (0.00%) · Last year $1,419,000 (+5.71%) - Average days active in MLS
- 27
Last month 28 (-3.57%) · Last year 24 (+12.50%) - Months supply of homes
- 3.0
Last month 2.9 (+3.45%) · Last year 3.7 (-18.92%) - Sold price vs. original list price (average)
- 99.3%
Last month 98.9% (+0.40%) · Last year 99.2% (+0.10%)
May 2026
Orange County single-family homes, compared with last month and the same month last year.
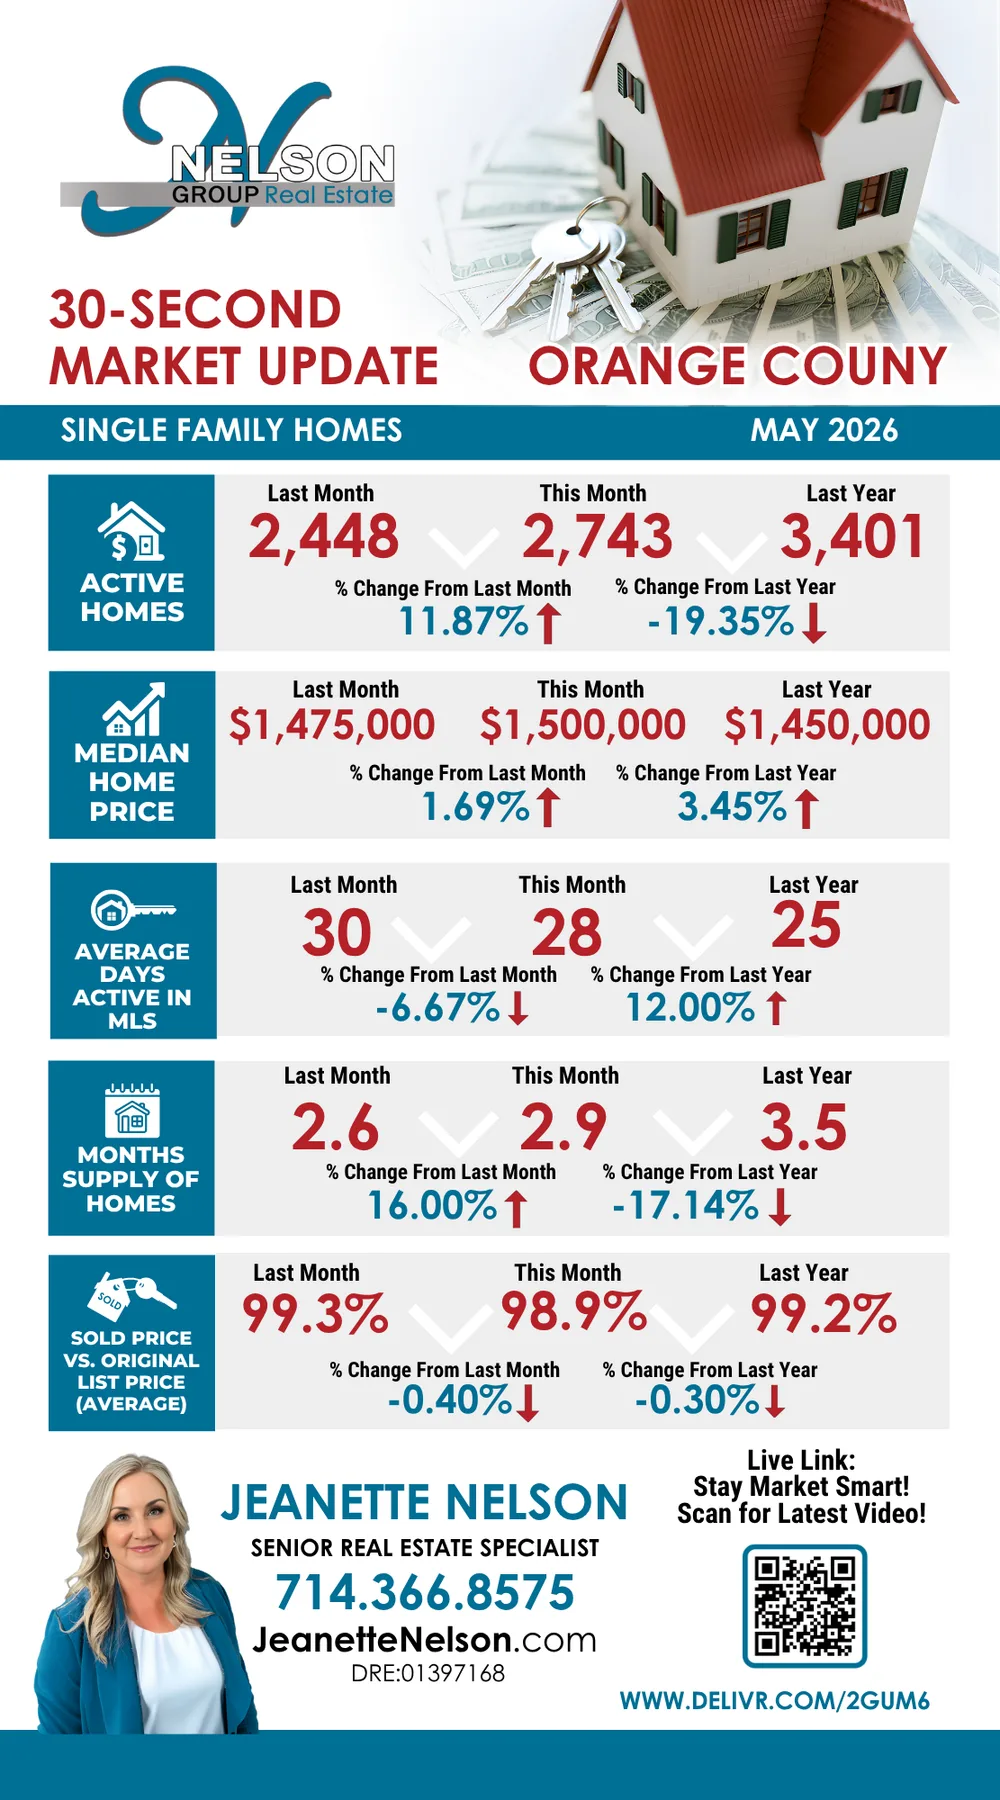
- Active homes
- 2,743
Last month 2,448 (+11.87%) · Last year 3,401 (-19.35%) - Median home price
- $1,500,000
Last month $1,475,000 (+1.69%) · Last year $1,450,000 (+3.45%) - Average days active in MLS
- 28
Last month 30 (-6.67%) · Last year 25 (+12.00%) - Months supply of homes
- 2.9
Last month 2.6 (+16.00%) · Last year 3.5 (-17.14%) - Sold price vs. original list price (average)
- 98.9%
Last month 99.3% (-0.40%) · Last year 99.2% (-0.30%)
April 2026
Orange County single-family homes, compared with last month and the same month last year.
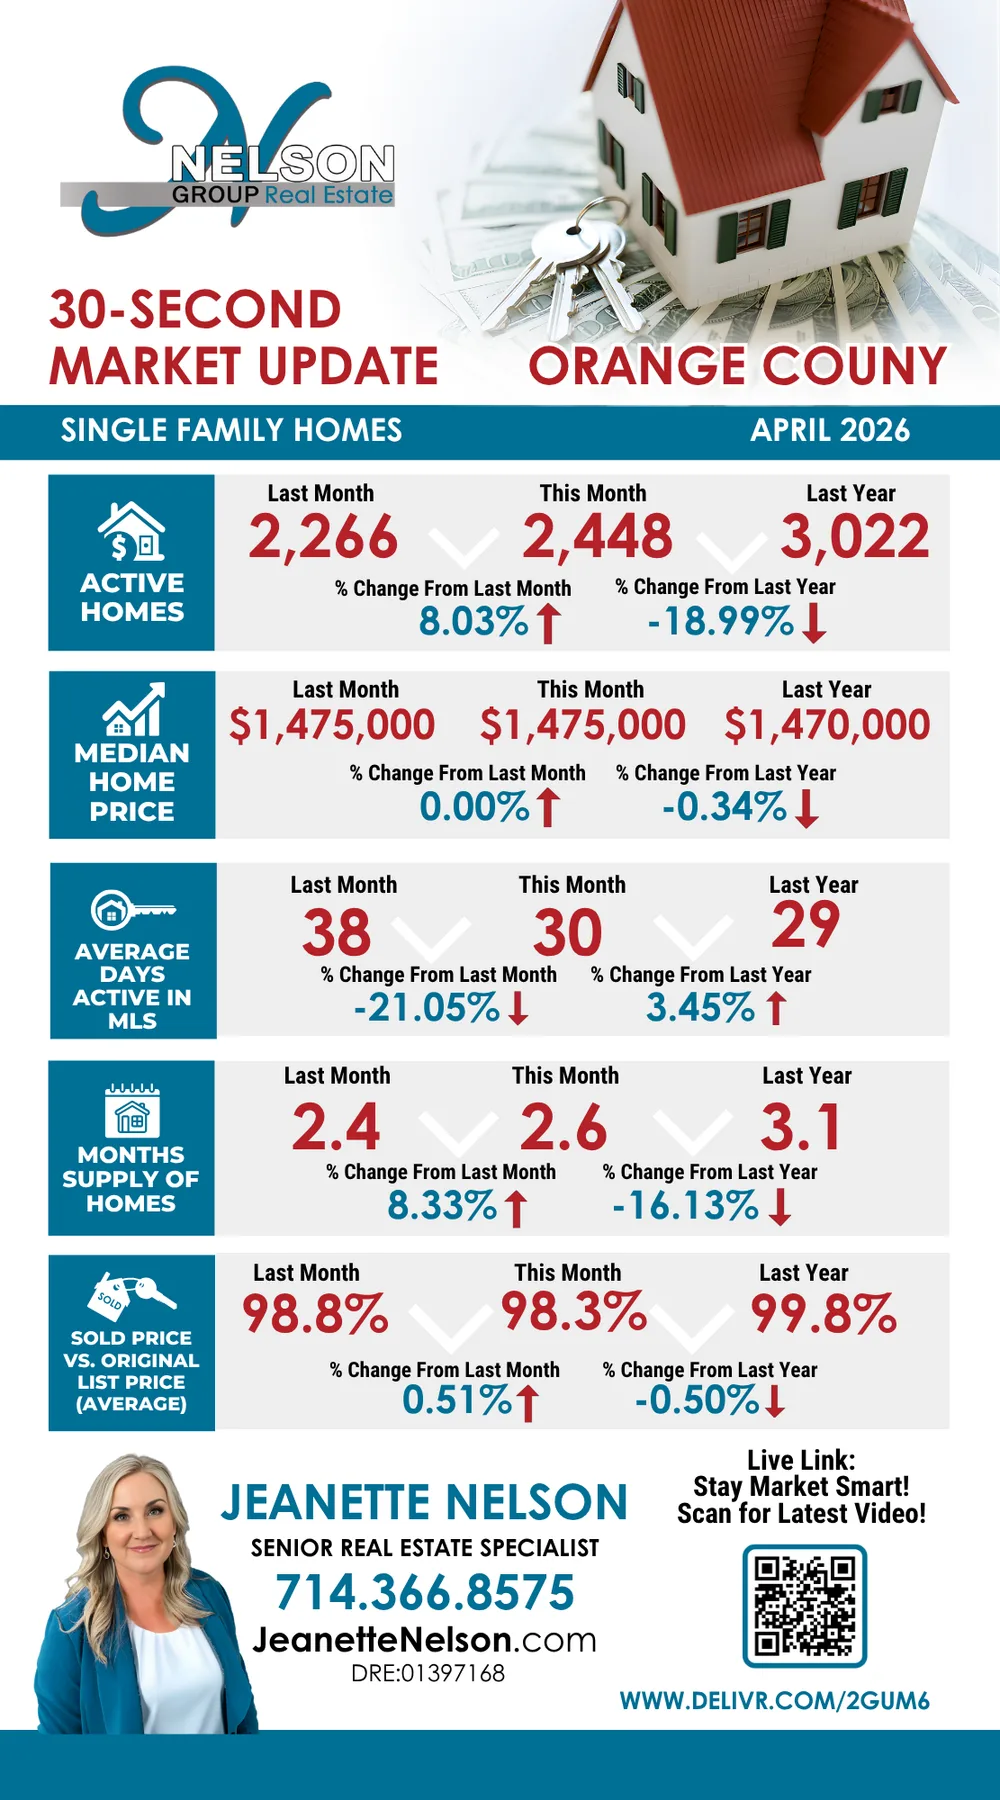
- Active homes
- 2,448
Last month 2,266 (+8.03%) · Last year 3,022 (-18.99%) - Median home price
- $1,475,000
Last month $1,475,000 (0.00%) · Last year $1,470,000 (-0.34%) - Average days active in MLS
- 30
Last month 38 (-21.05%) · Last year 29 (+3.45%) - Months supply of homes
- 2.6
Last month 2.4 (+8.33%) · Last year 3.1 (-16.13%) - Sold price vs. original list price (average)
- 98.3%
Last month 98.8% (+0.51%) · Last year 99.8% (-0.50%)
March 2026
Orange County single-family homes, compared with last month and the same month last year.
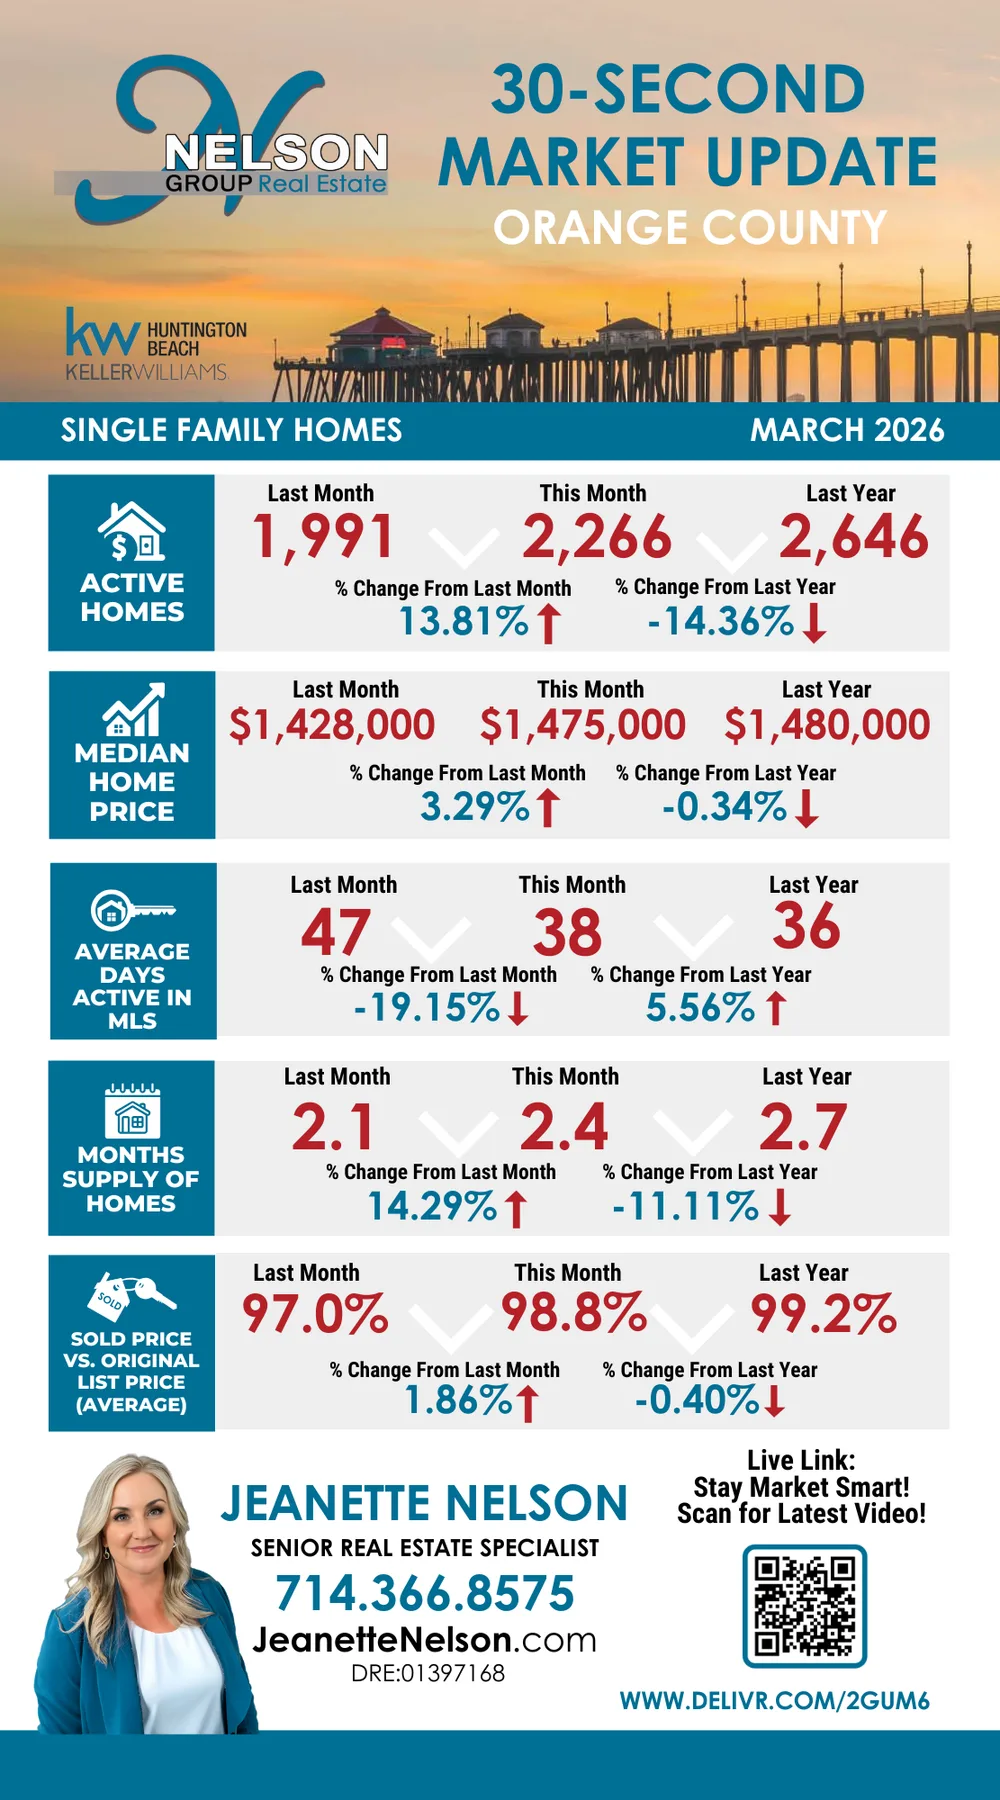
- Active homes
- 2,266
Last month 1,991 (+13.81%) · Last year 2,646 (-14.36%) - Median home price
- $1,475,000
Last month $1,428,000 (+3.29%) · Last year $1,480,000 (-0.34%) - Average days active in MLS
- 38
Last month 47 (-19.15%) · Last year 36 (+5.56%) - Months supply of homes
- 2.4
Last month 2.1 (+14.29%) · Last year 2.7 (-11.11%) - Sold price vs. original list price (average)
- 98.8%
Last month 97.0% (+1.86%) · Last year 99.2% (-0.40%)
February 2026
Orange County single-family homes, compared with last month and the same month last year.
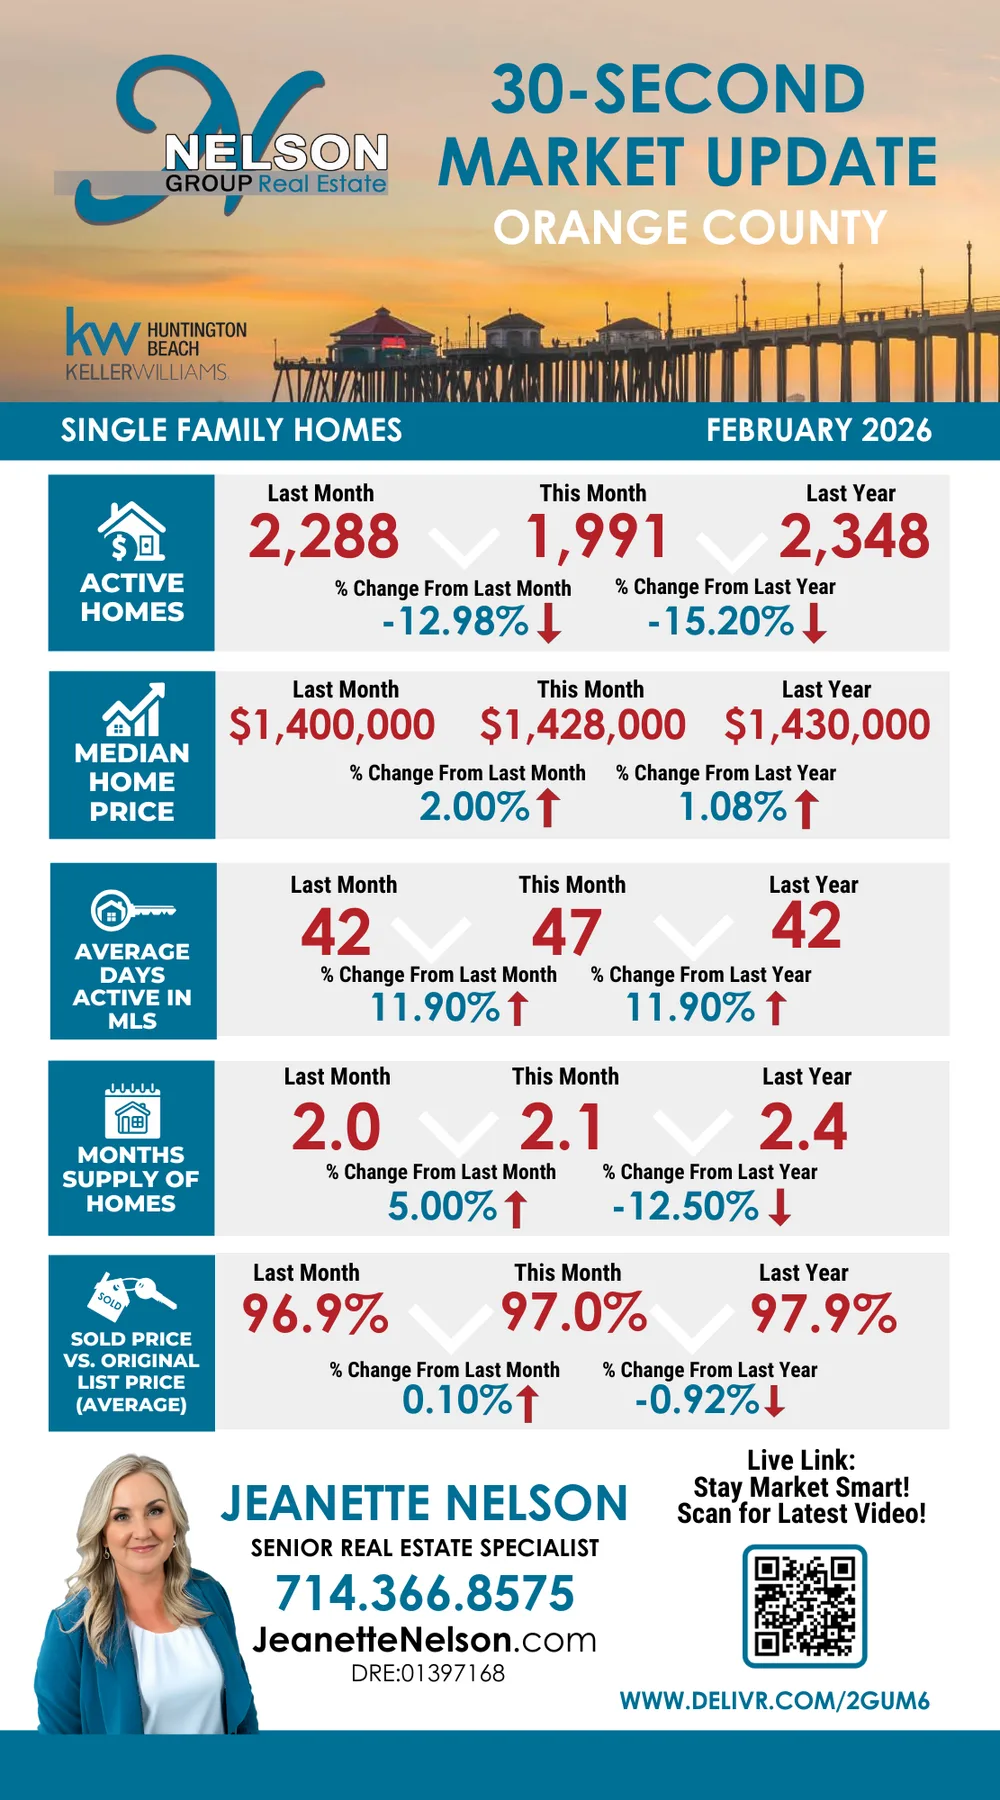
- Active homes
- 1,991
Last month 2,288 (-12.98%) · Last year 2,348 (-15.20%) - Median home price
- $1,428,000
Last month $1,400,000 (+2.00%) · Last year $1,430,000 (+1.08%) - Average days active in MLS
- 47
Last month 42 (+11.90%) · Last year 42 (+11.90%) - Months supply of homes
- 2.1
Last month 2.0 (+5.00%) · Last year 2.4 (-12.50%) - Sold price vs. original list price (average)
- 97.0%
Last month 96.9% (+0.10%) · Last year 97.9% (-0.92%)
December 2025
Orange County single-family homes, compared with last month and the same month last year.
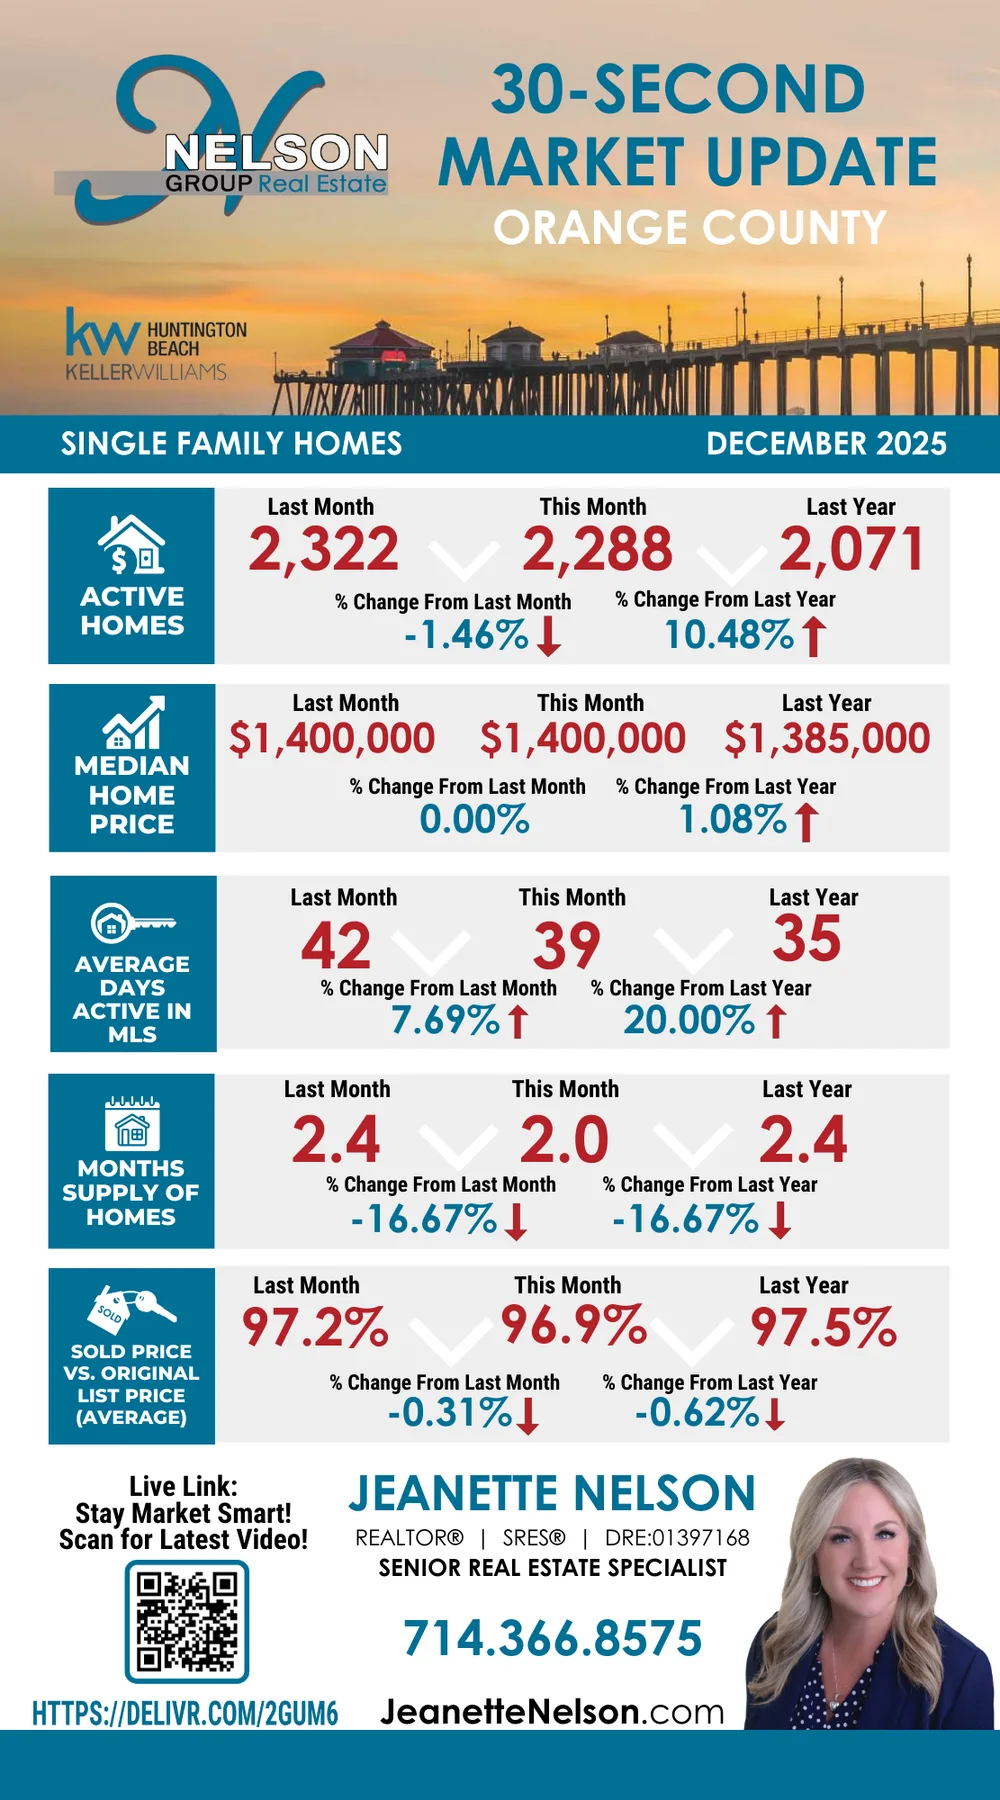
- Active homes
- 2,288
Last month 2,322 (-1.46%) · Last year 2,071 (+10.48%) - Median home price
- $1,400,000
Last month $1,400,000 (0.00%) · Last year $1,385,000 (+1.08%) - Average days active in MLS
- 39
Last month 42 (+7.69%) · Last year 35 (+20.00%) - Months supply of homes
- 2.0
Last month 2.4 (-16.67%) · Last year 2.4 (-16.67%) - Sold price vs. original list price (average)
- 96.9%
Last month 97.2% (-0.31%) · Last year 97.5% (-0.62%)
November 2025
Orange County single-family homes, compared with last month and the same month last year.
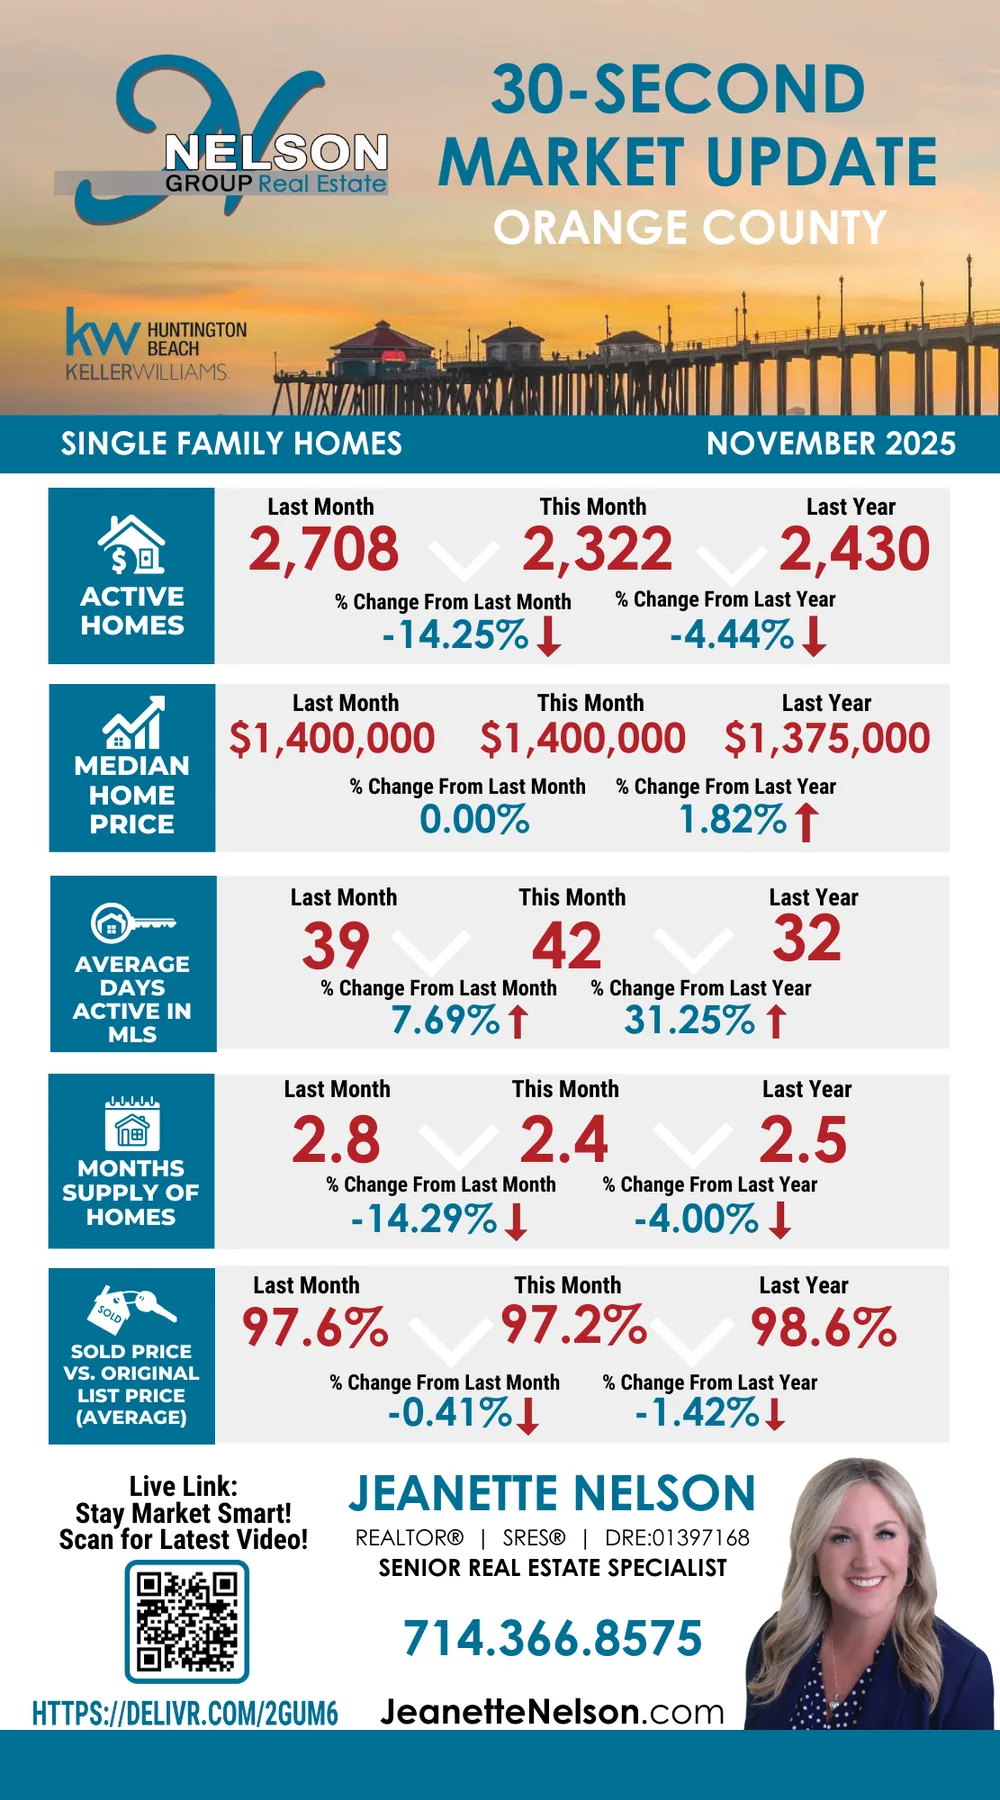
- Active homes
- 2,322
Last month 2,708 (-14.25%) · Last year 2,430 (-4.44%) - Median home price
- $1,400,000
Last month $1,400,000 (0.00%) · Last year $1,375,000 (+1.82%) - Average days active in MLS
- 42
Last month 39 (+7.69%) · Last year 32 (+31.25%) - Months supply of homes
- 2.4
Last month 2.8 (-14.29%) · Last year 2.5 (-4.00%) - Sold price vs. original list price (average)
- 97.2%
Last month 97.6% (-0.41%) · Last year 98.6% (-1.42%)
October 2025
Orange County single-family homes, compared with last month and the same month last year.
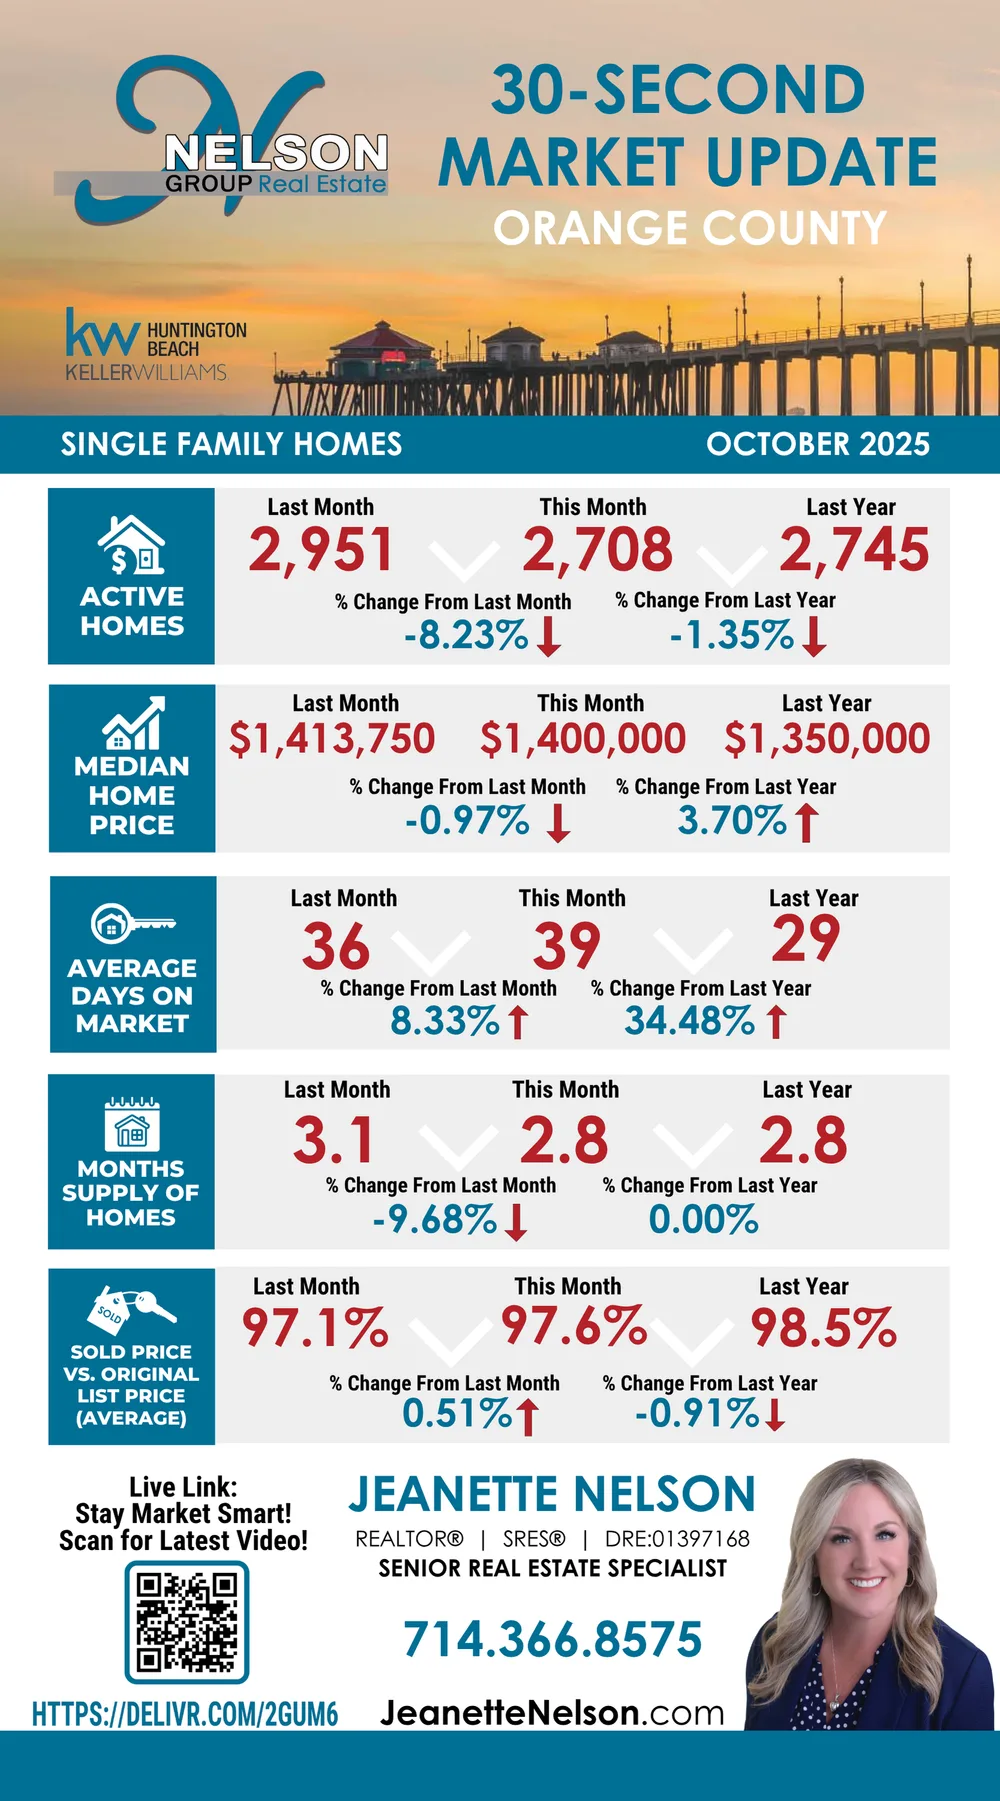
- Active homes
- 2,708
Last month 2,951 (-8.23%) · Last year 2,745 (-1.35%) - Median home price
- $1,400,000
Last month $1,413,750 (-0.97%) · Last year $1,350,000 (+3.70%) - Average days on market
- 39
Last month 36 (+8.33%) · Last year 29 (+34.48%) - Months supply of homes
- 2.8
Last month 3.1 (-9.68%) · Last year 2.8 (0.00%) - Sold price vs. original list price (average)
- 97.6%
Last month 97.1% (+0.51%) · Last year 98.5% (-0.91%)
Curious what the market means for your home? Get a home value estimate or talk with Jeanette.
Related pages
Ready to make your move with Jeanette Nelson Real Estate?